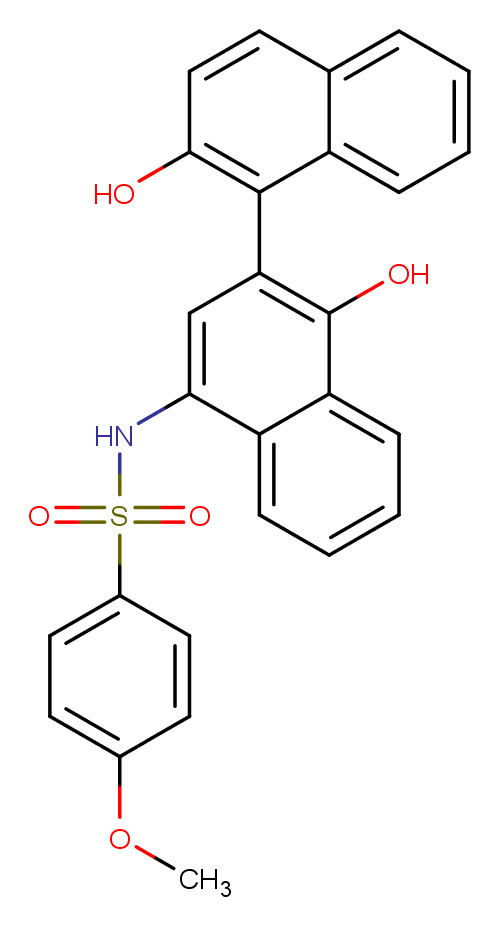
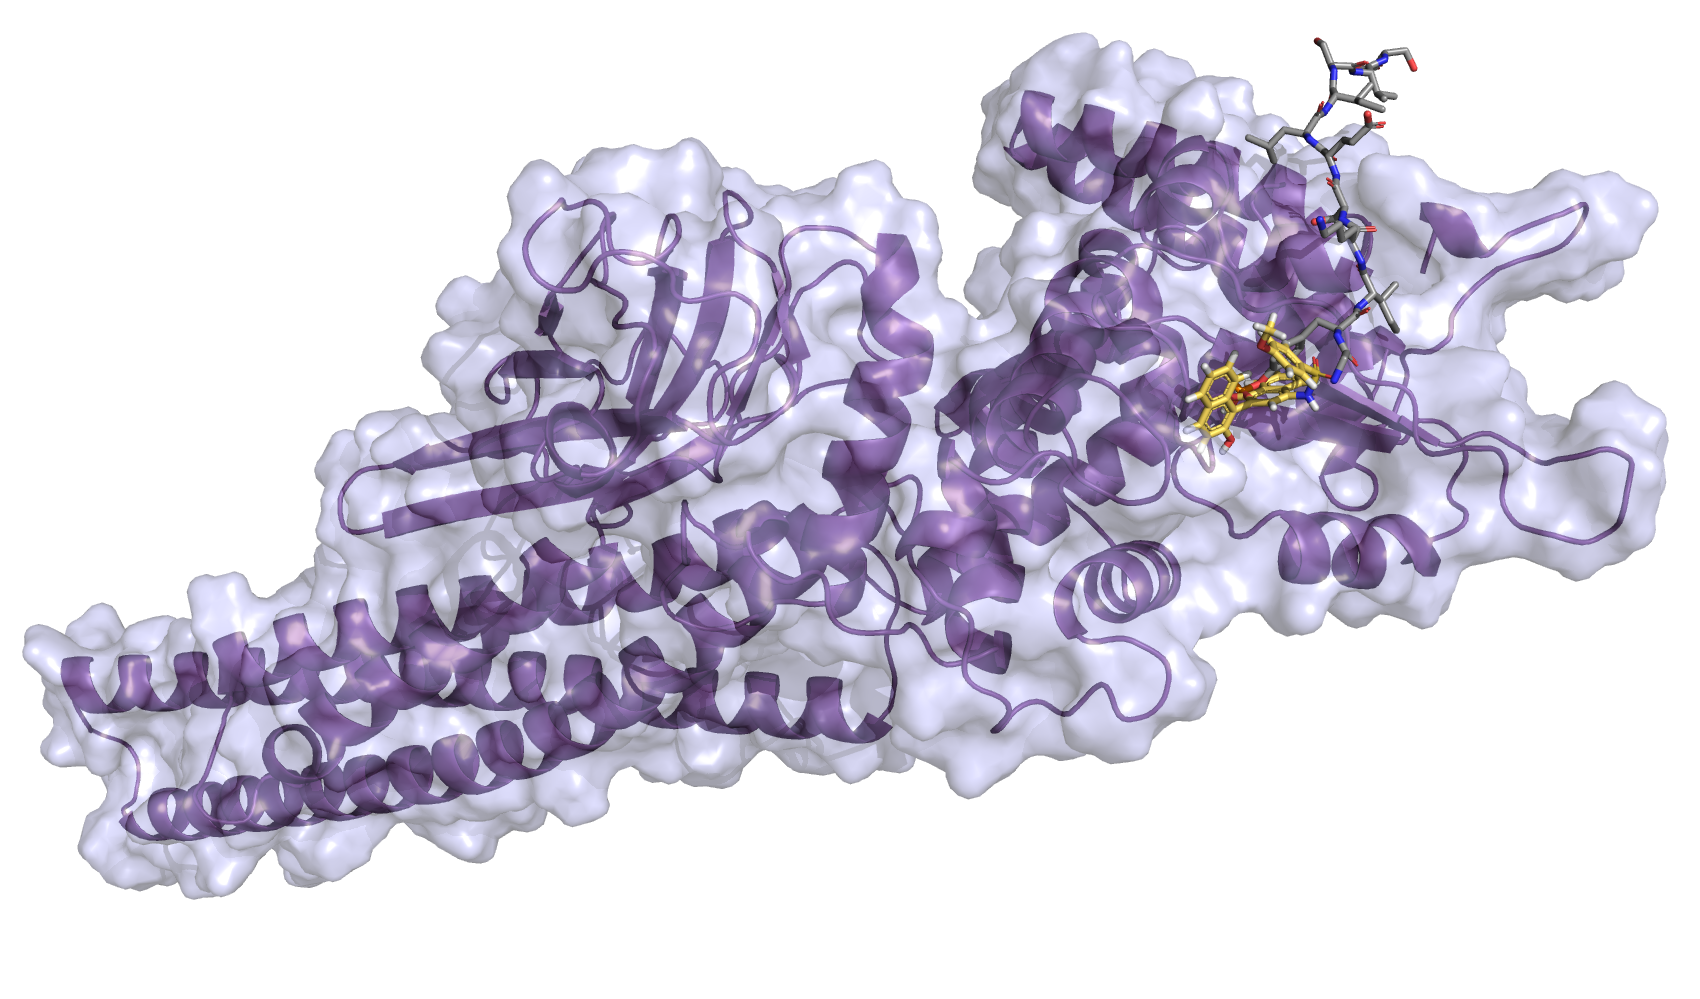
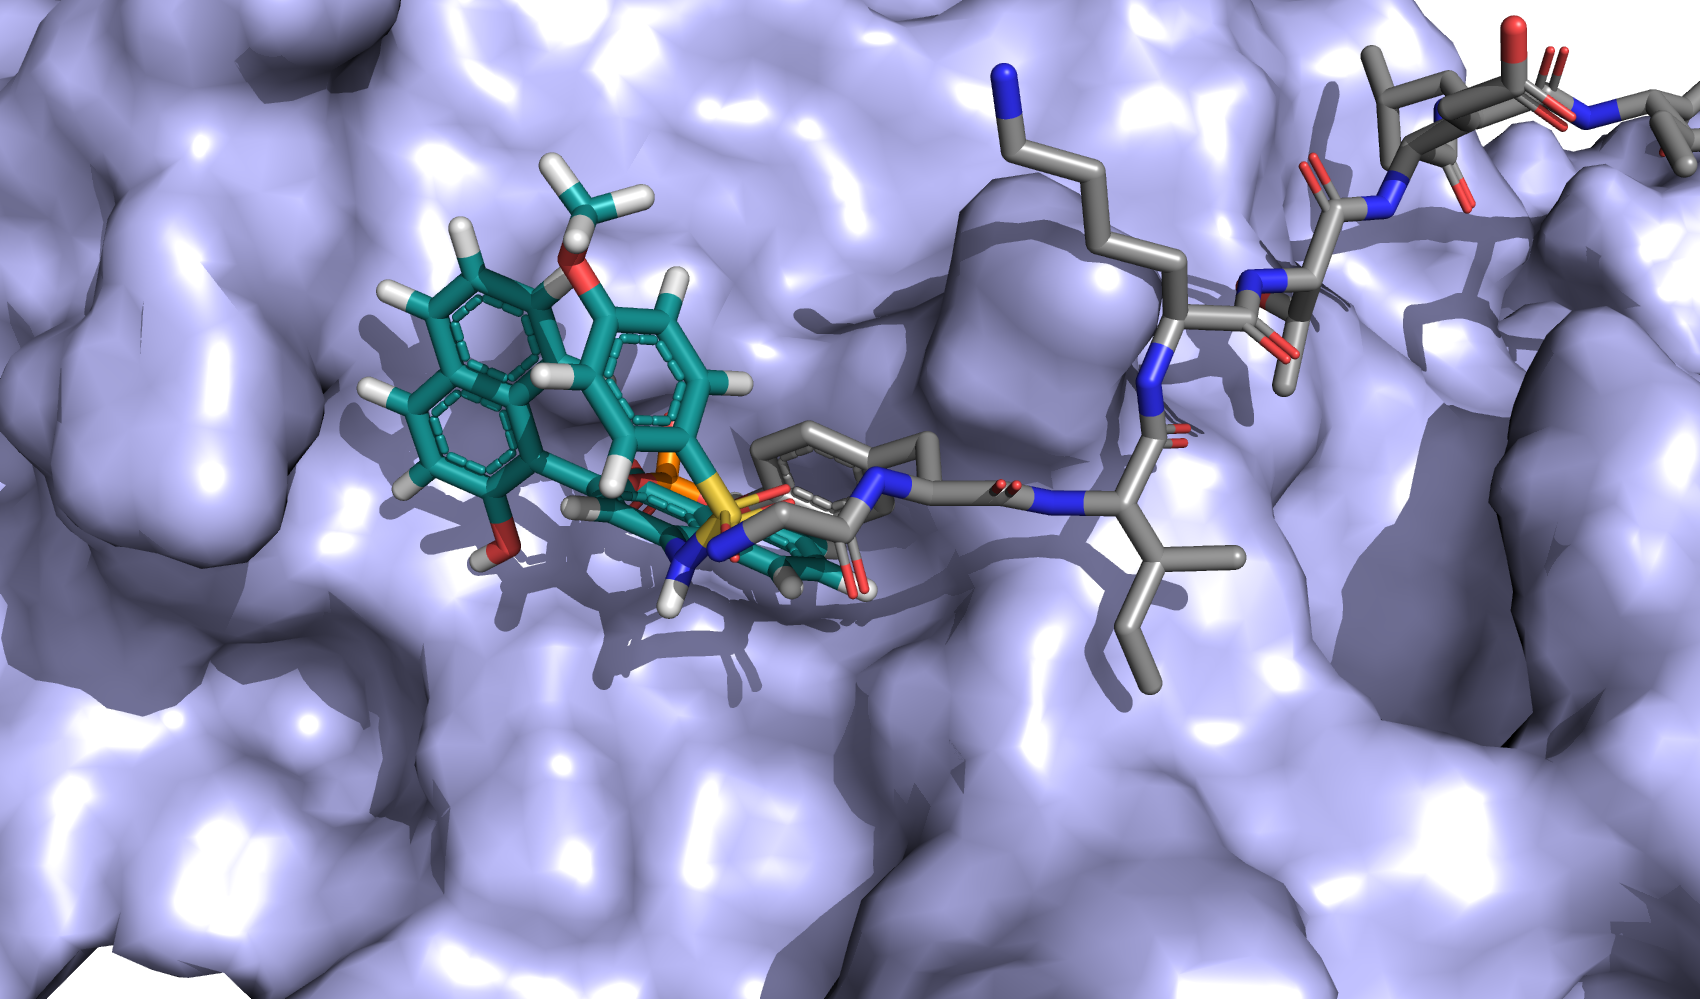
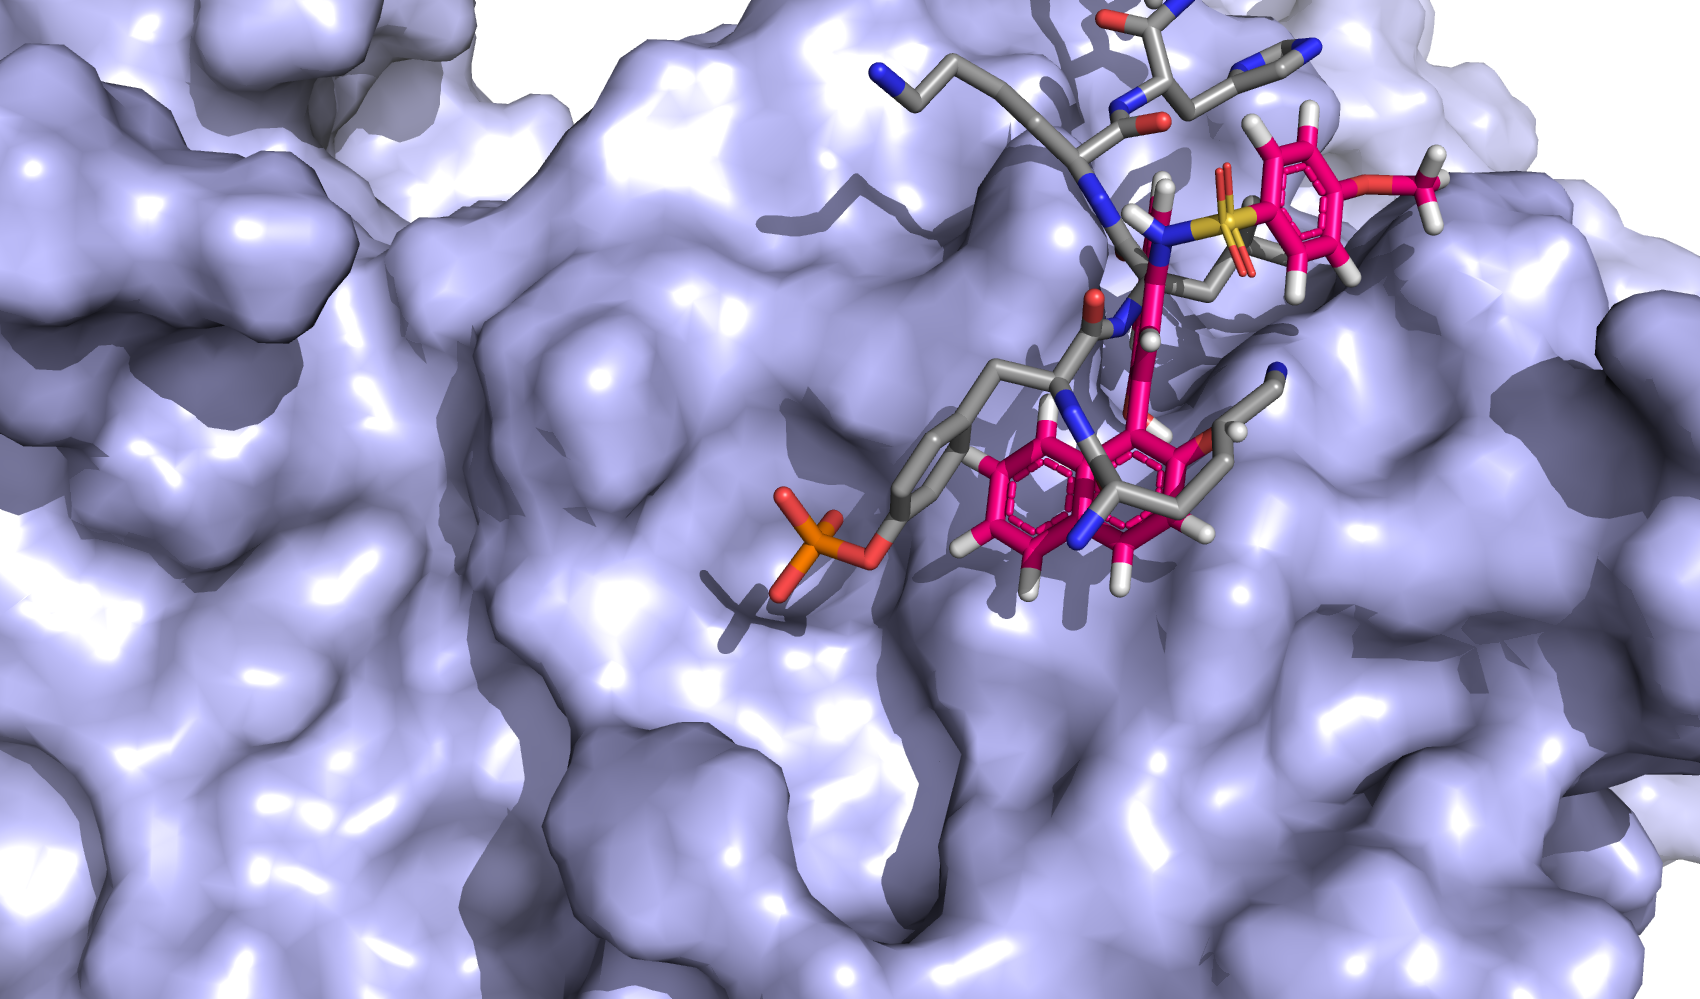
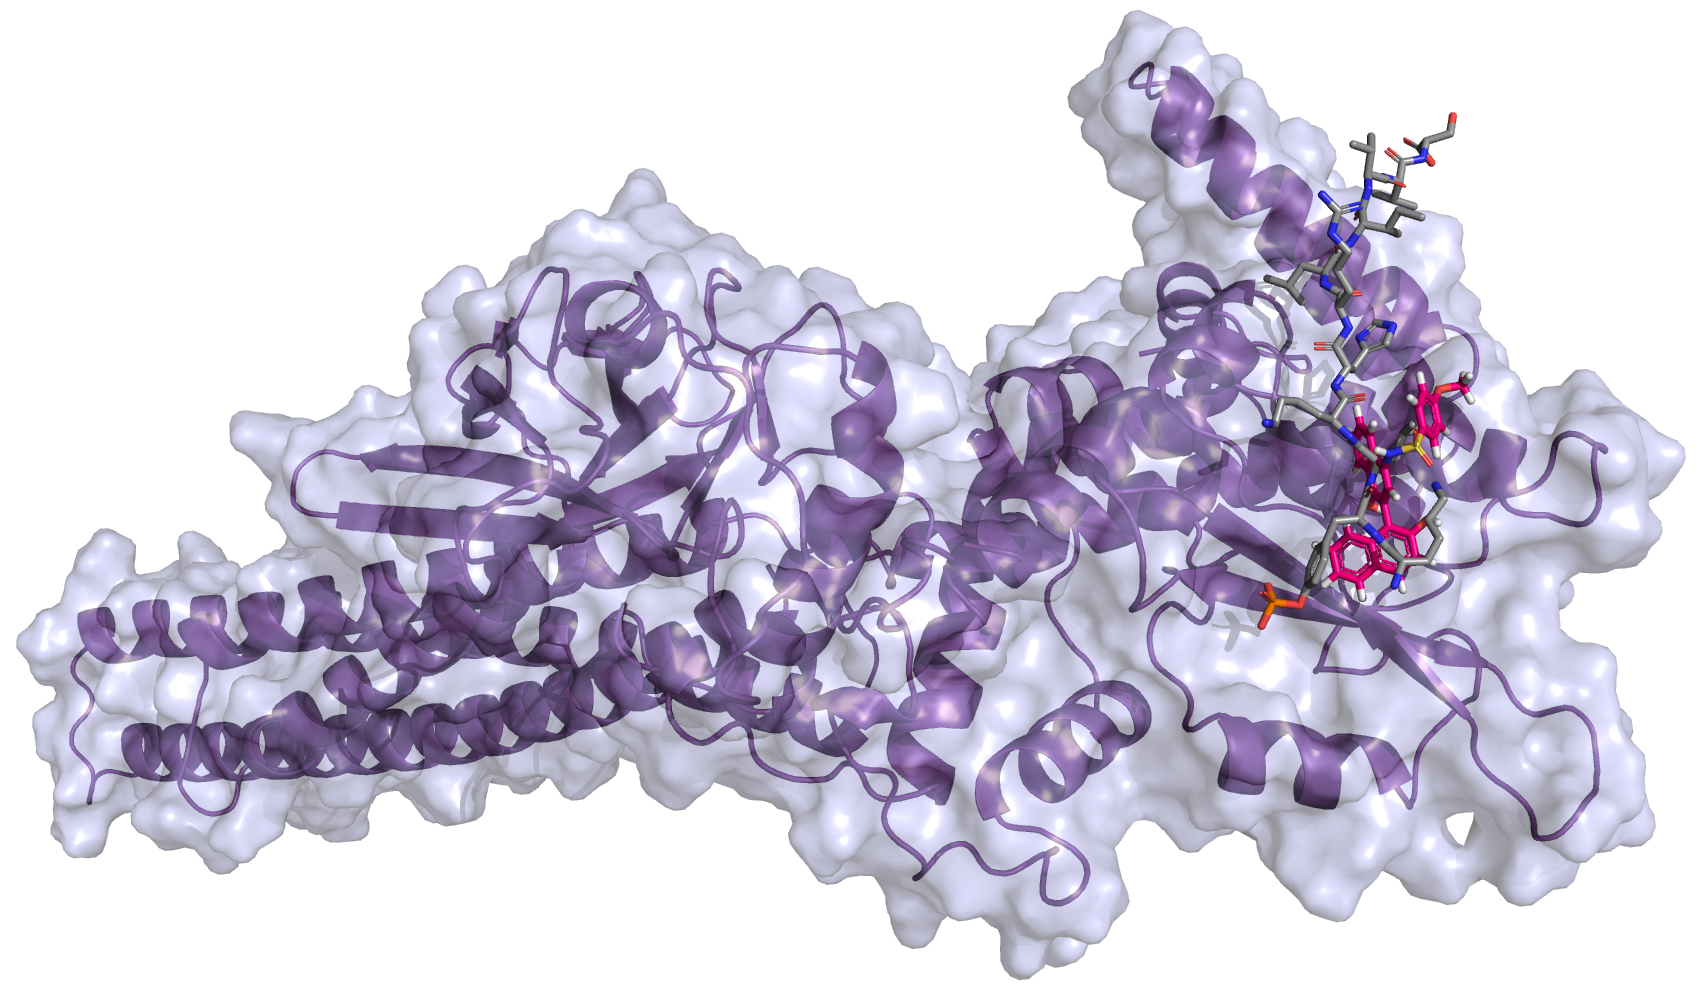
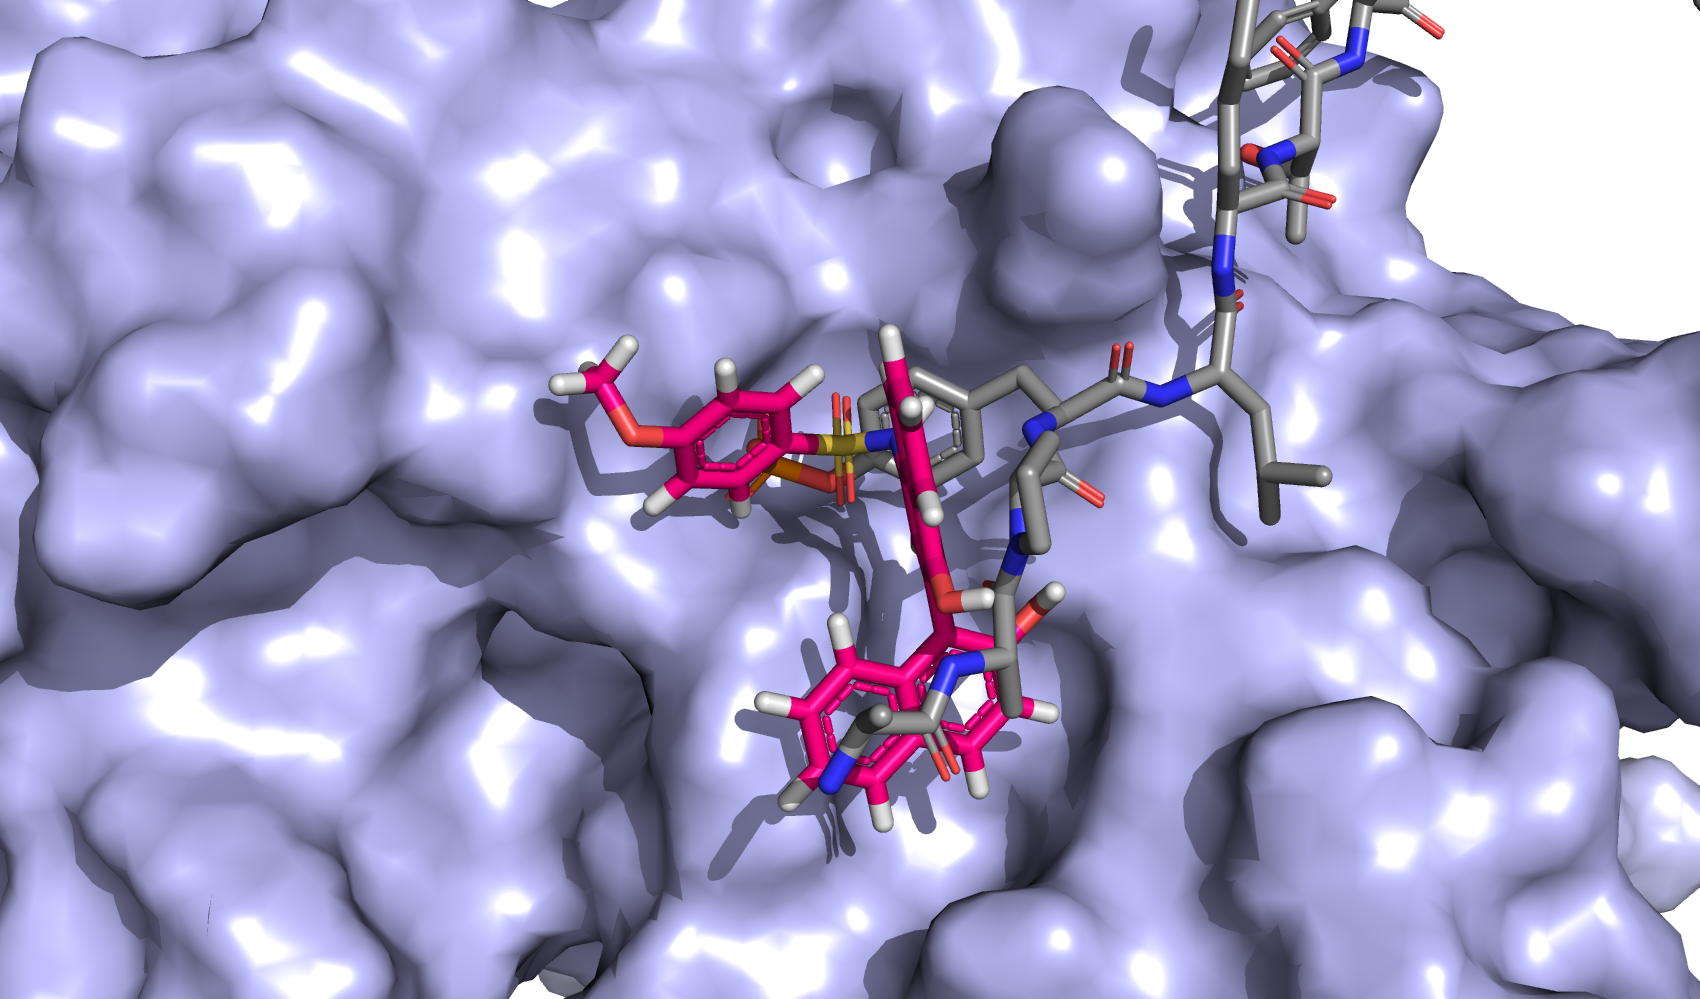
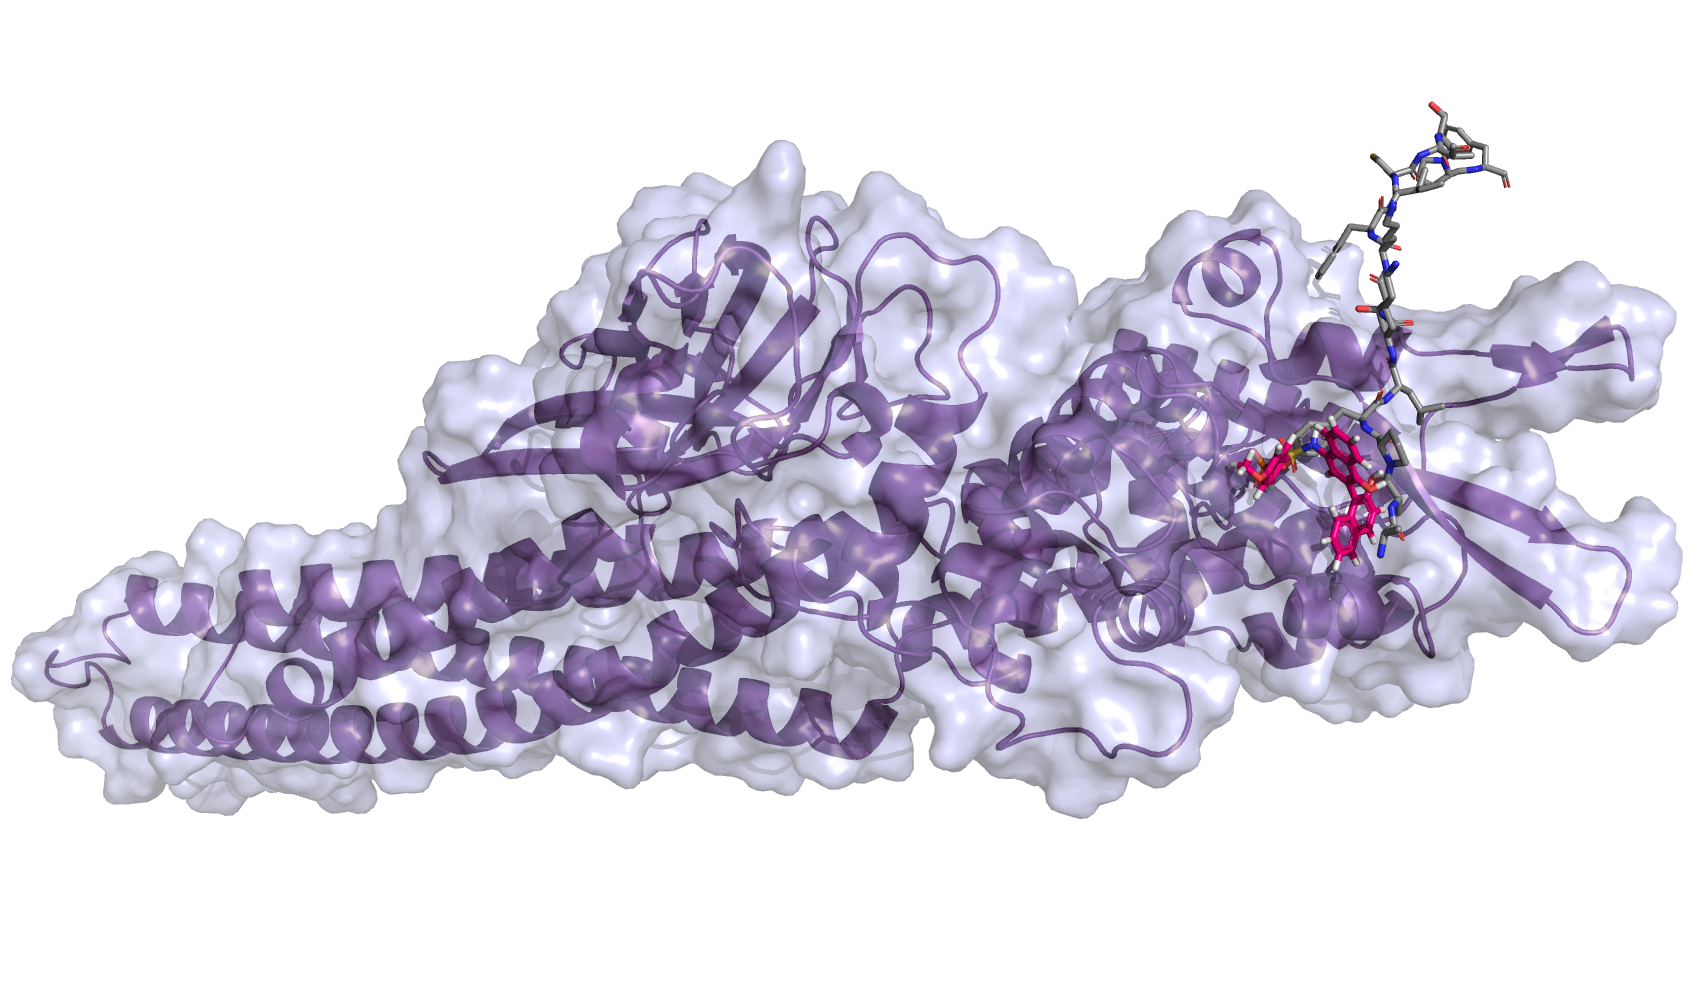
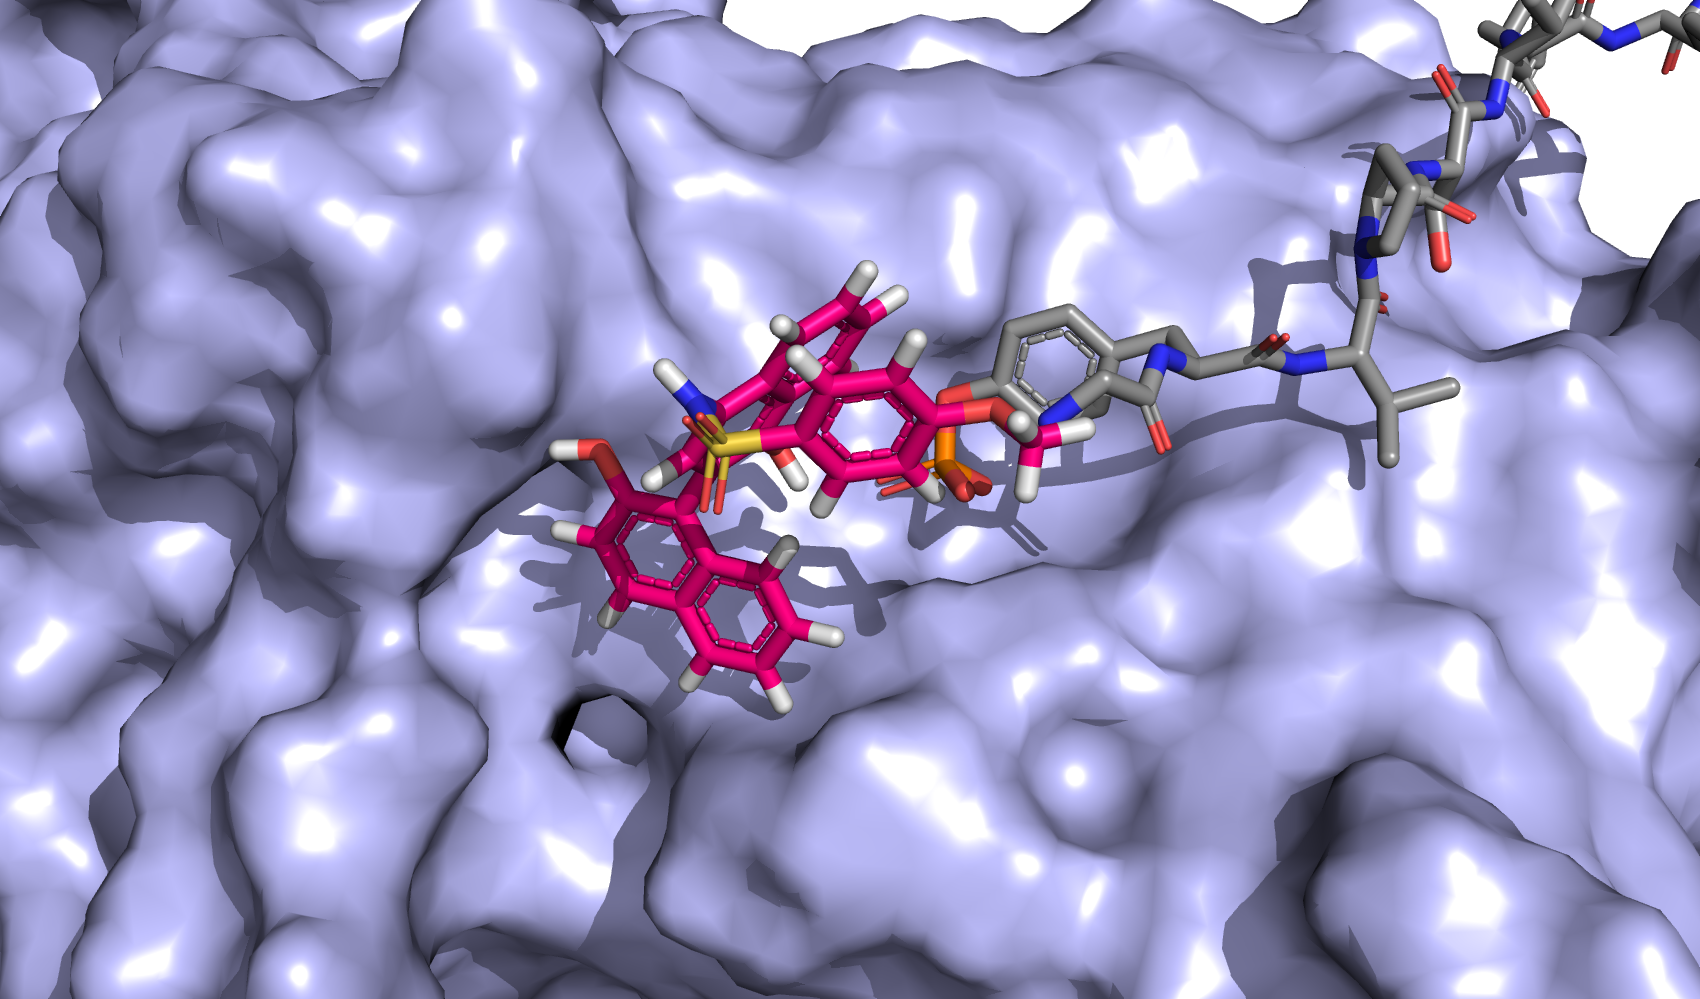
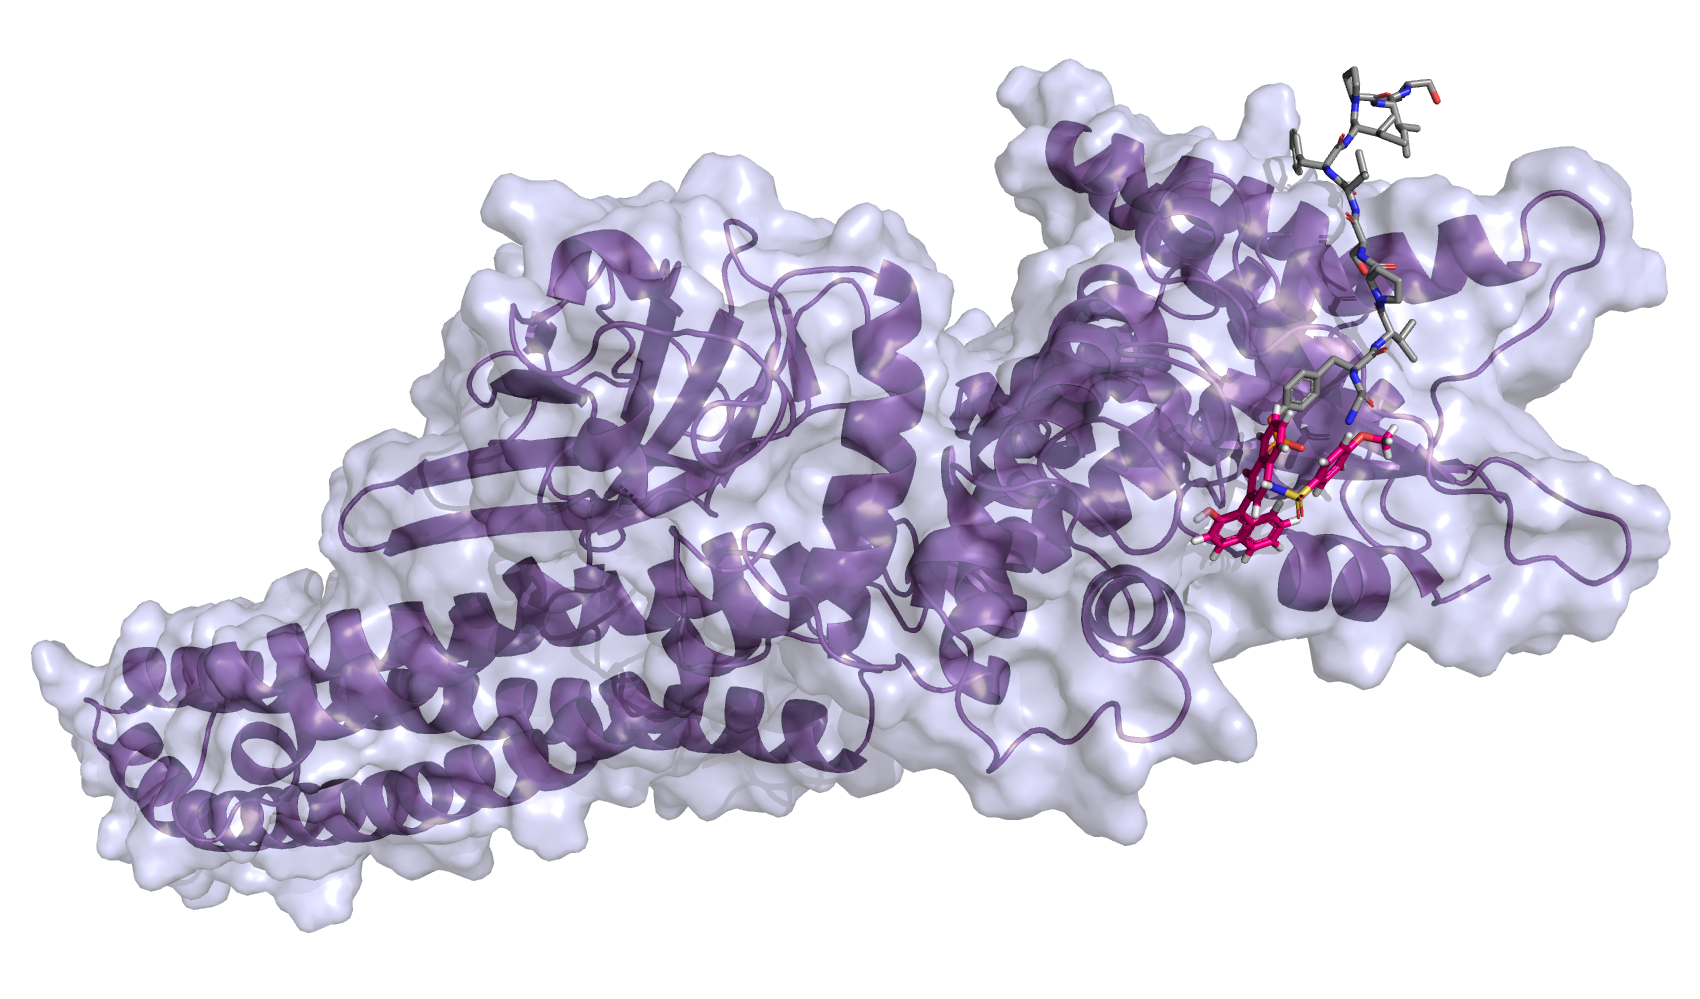
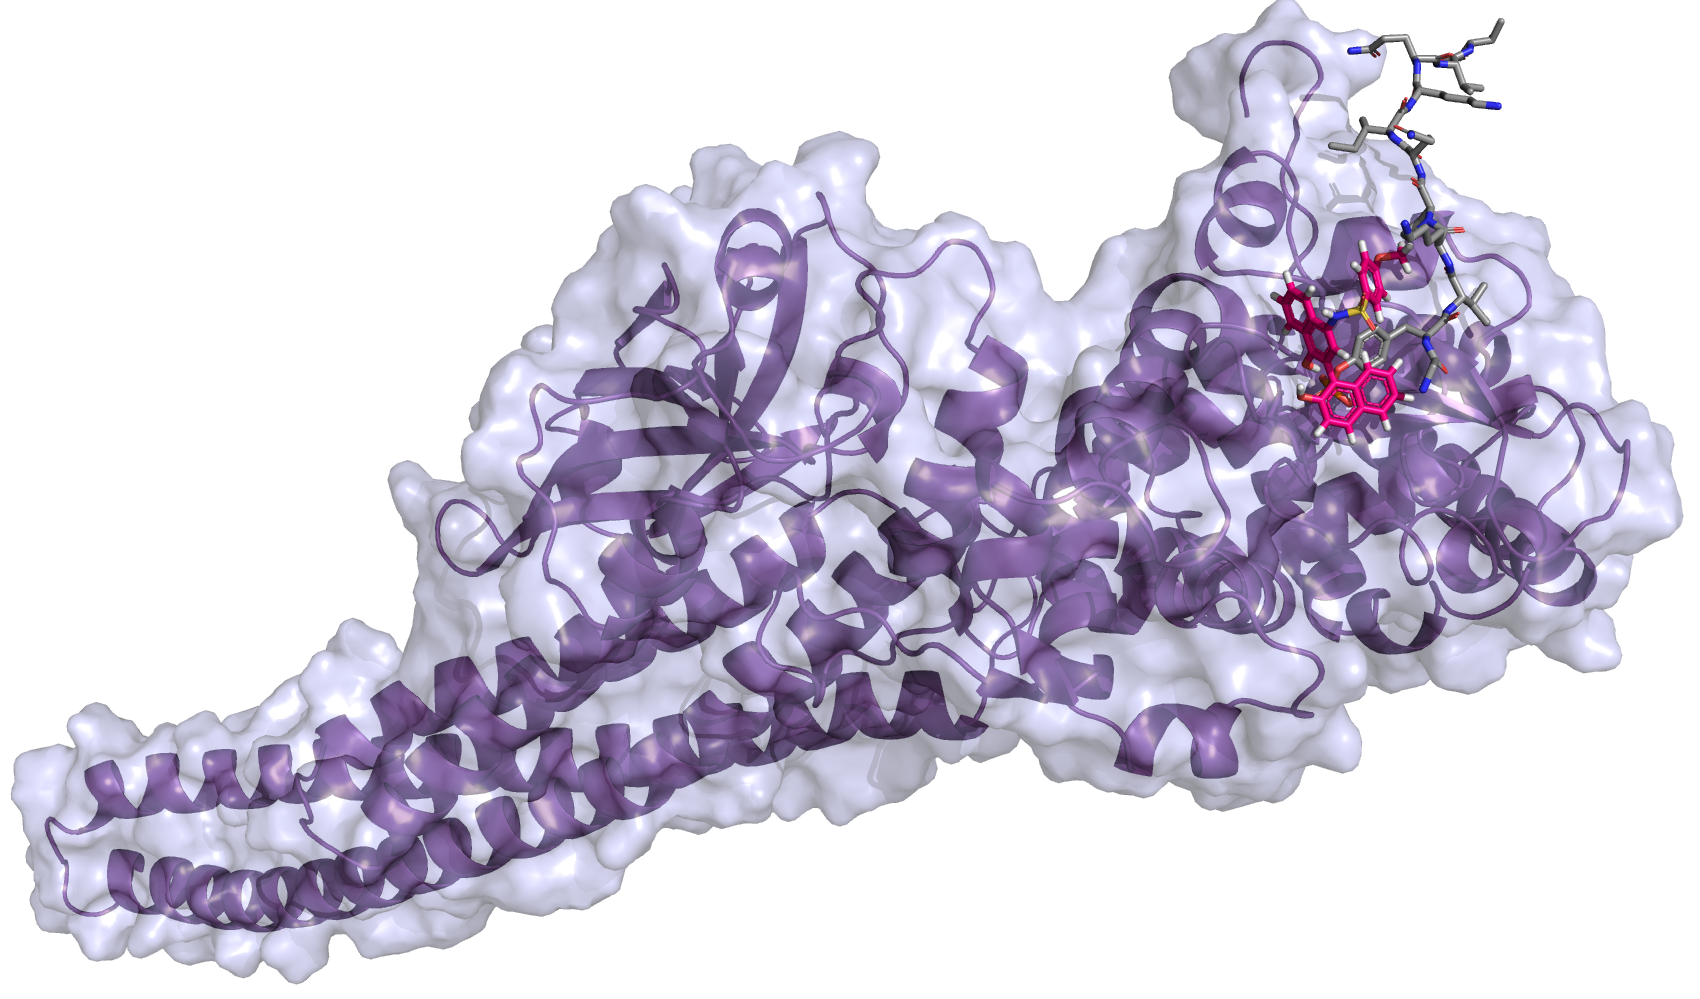
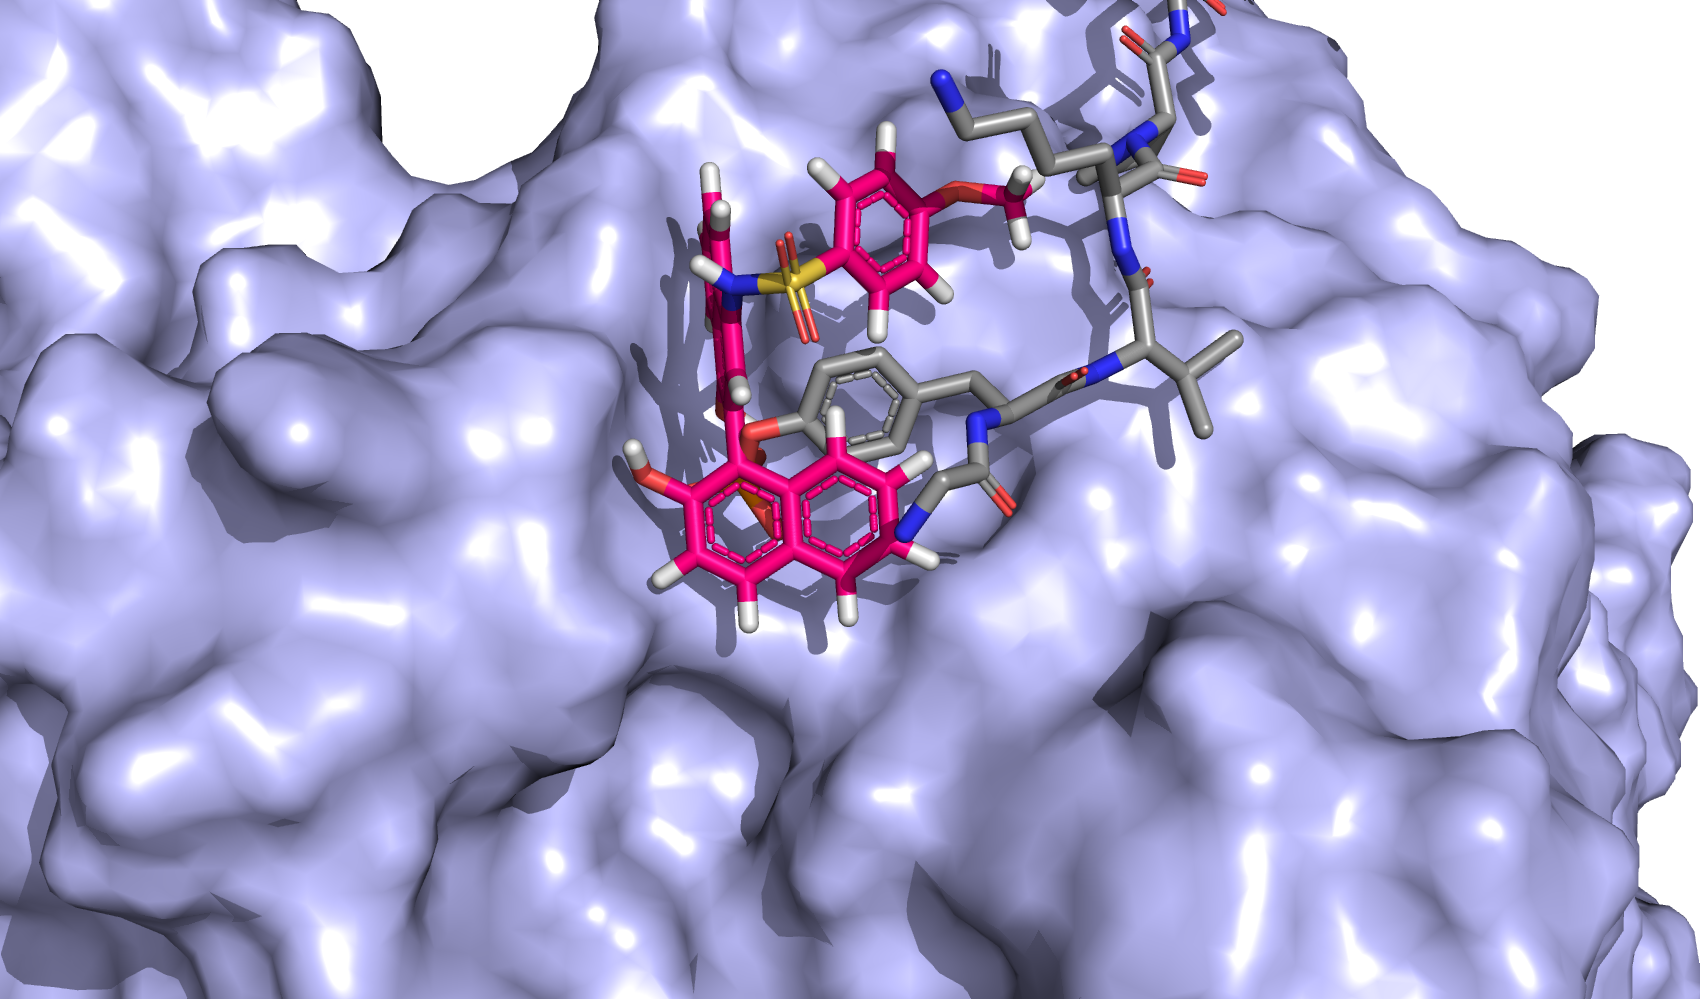
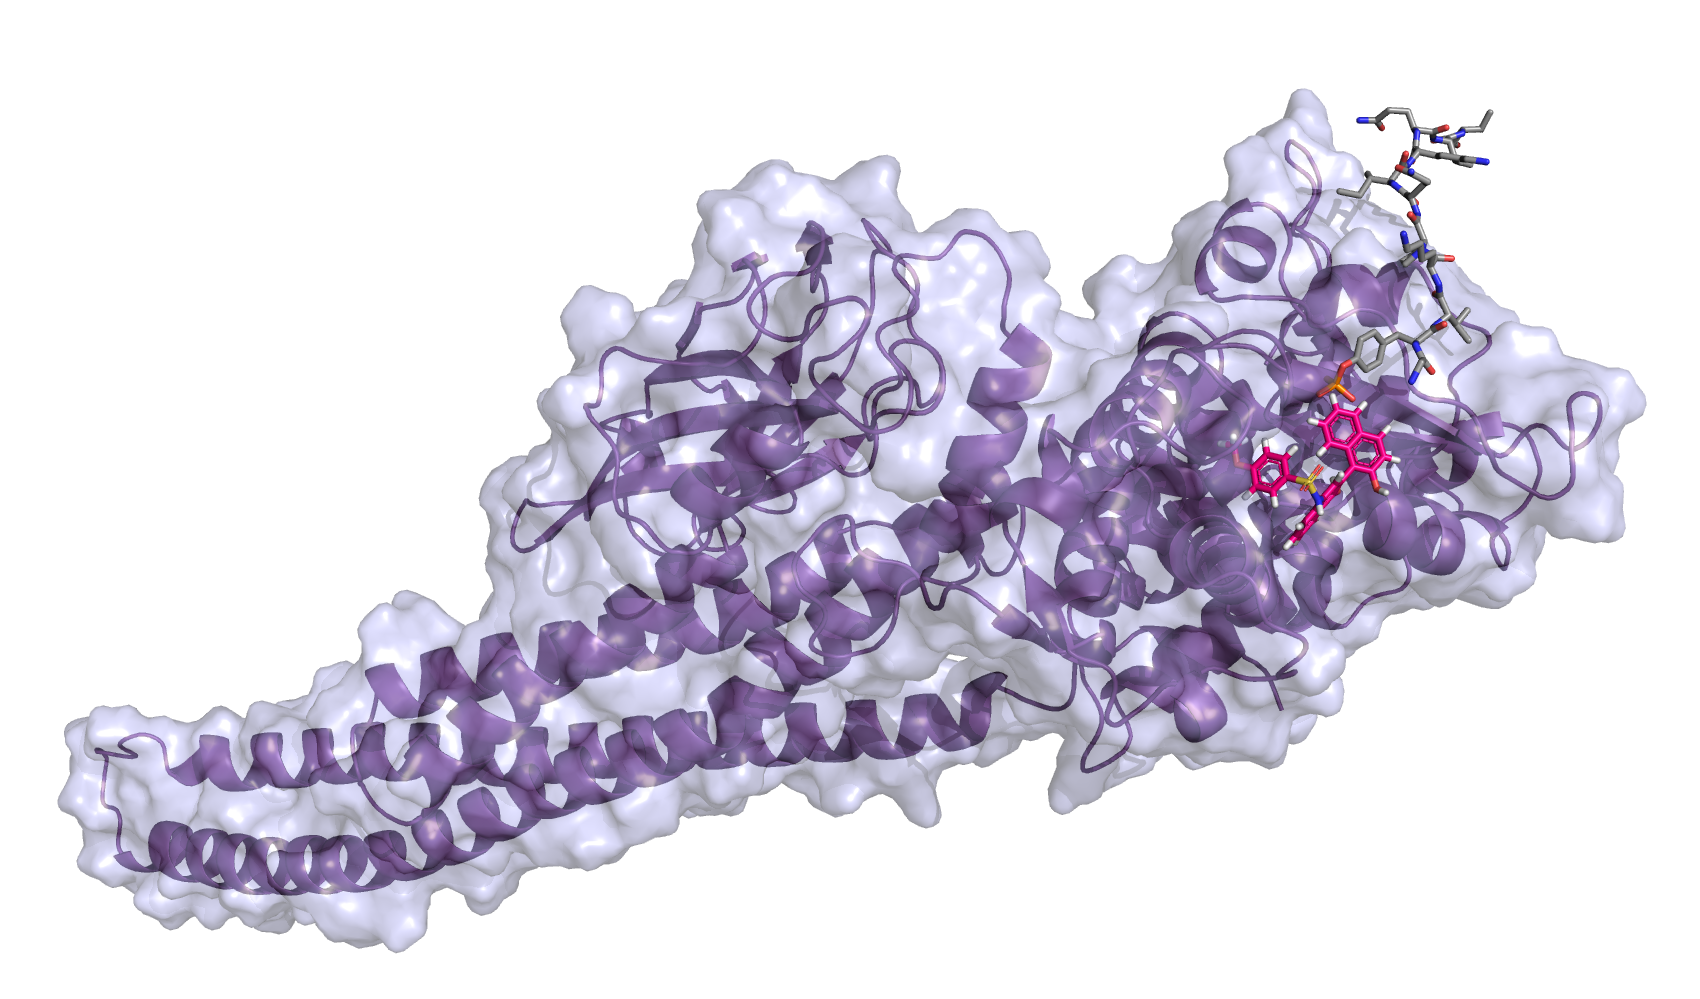
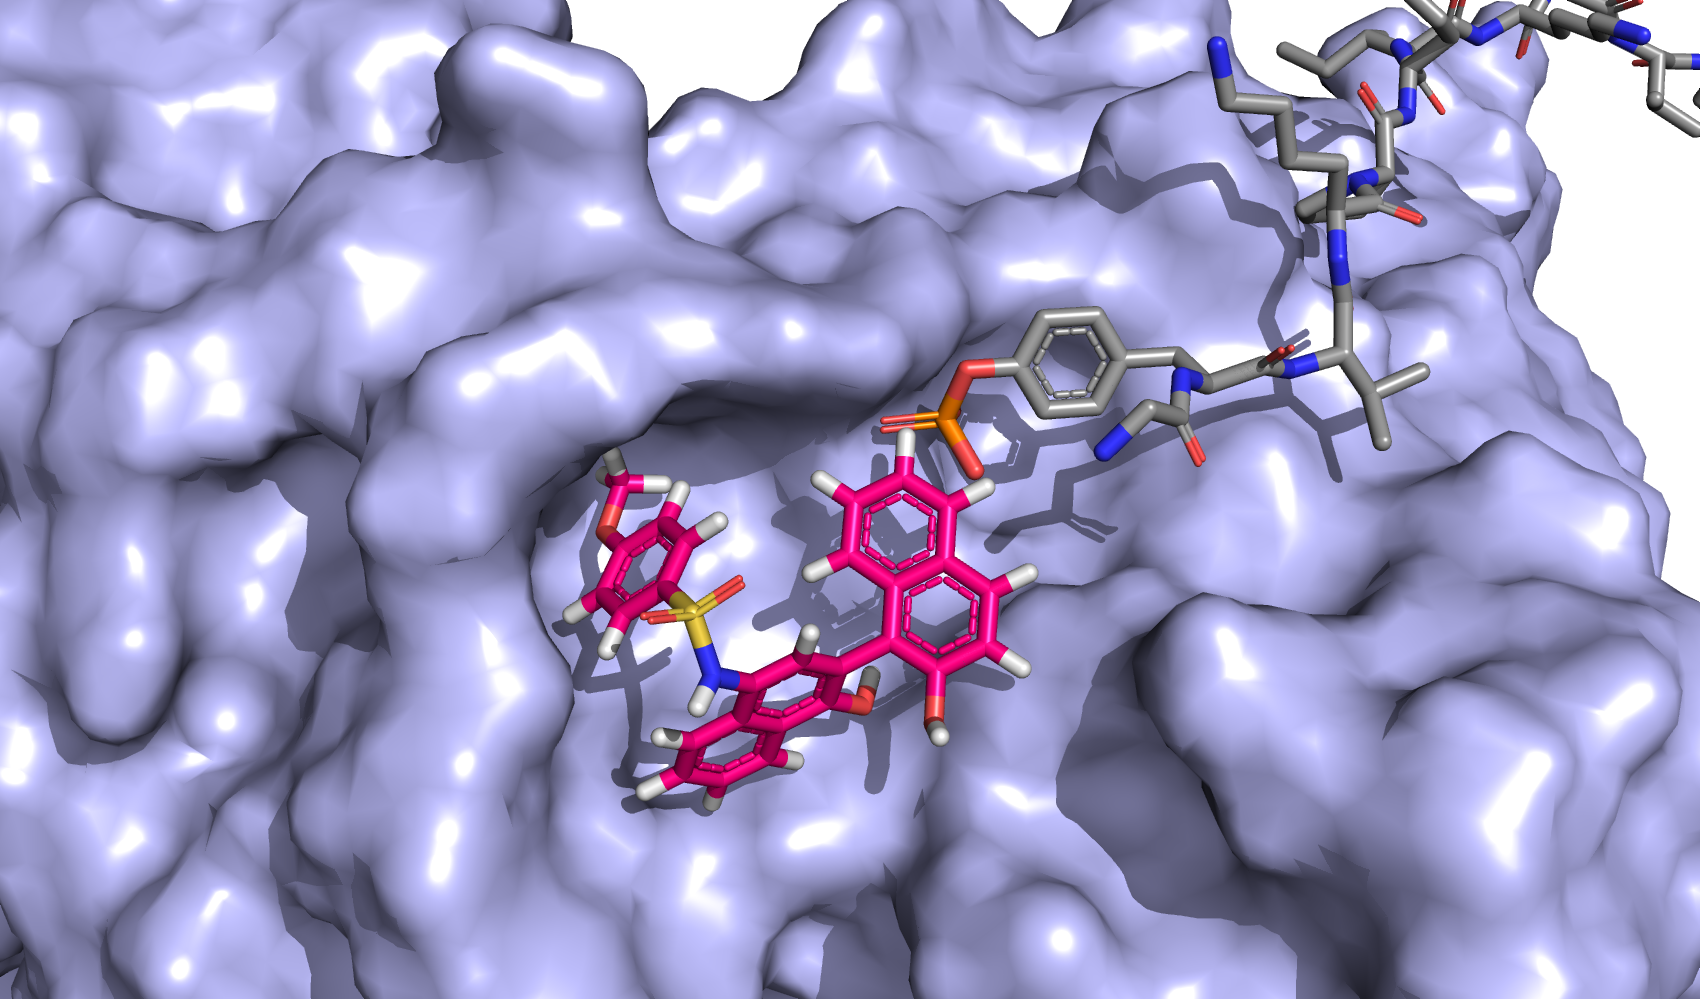
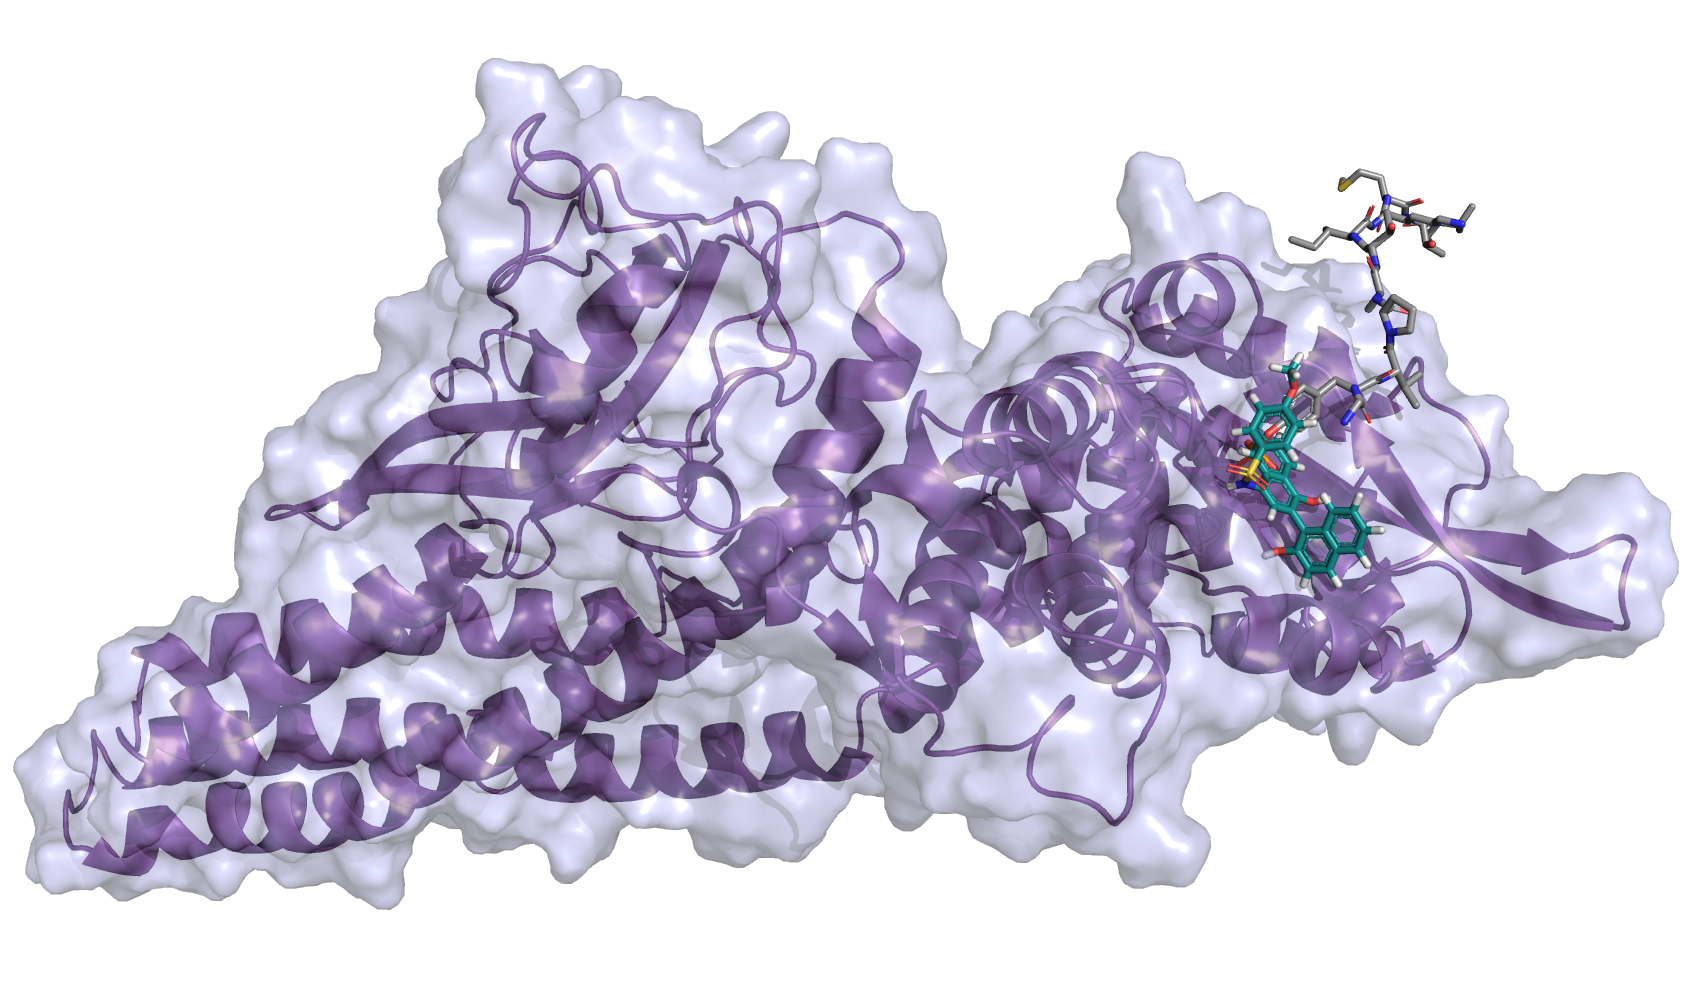
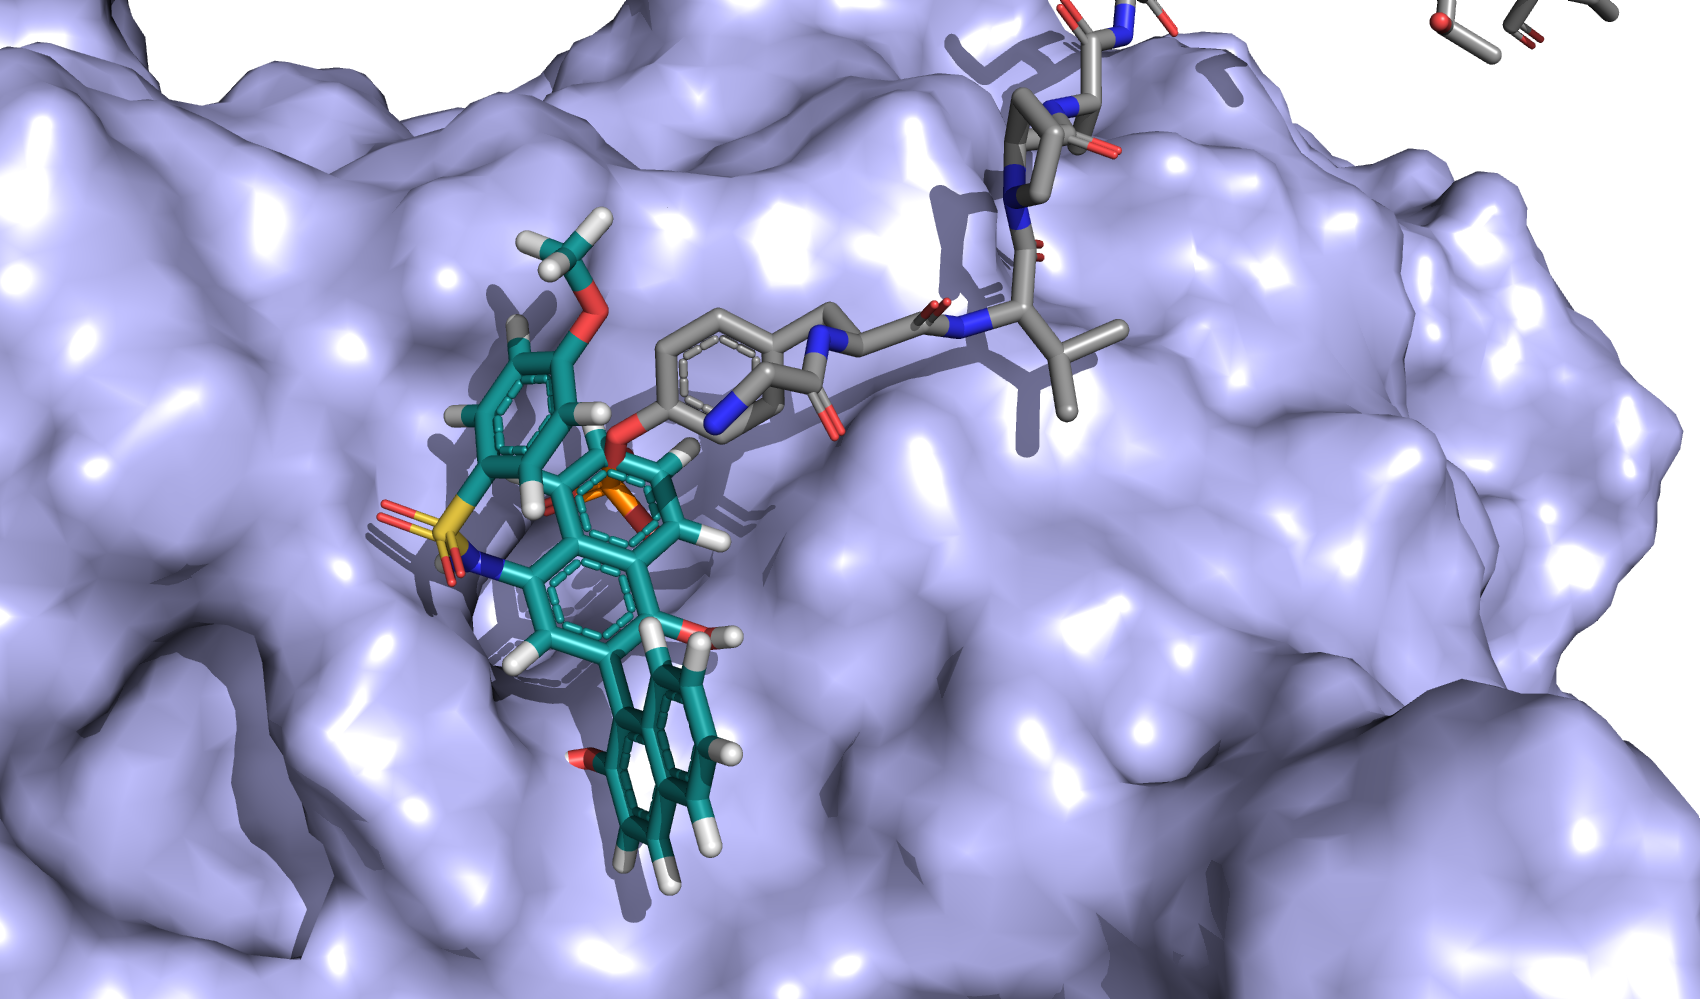
| C188-9 |
Structure Activity Realtionship SAR |
Structure comparision |
N/A N/A |
|
|
|
|
|
| C188-9 |
SPR |
Biacore sensorchip-immobilized phosphododecapeptide ligand |
N/A µM |
|
Homo sapiens |
|
STAT3 |
|
| C188-9 |
Phosphoflow |
Influence on proteins activity |
1.00 µM |
Kasumi-1 |
Homo sapiens |
|
p-STAT3 (Tyr-705) |
|
| C188-9 |
Phosphoflow |
Influence on proteins activity |
3.00 µM |
Kasumi-1 |
Homo sapiens |
|
p-STAT3 (Tyr-705) |
|
| C188-9 |
Phosphoflow |
Influence on proteins activity |
10.00 µM |
Kasumi-1 |
Homo sapiens |
|
p-STAT3 (Tyr-705) |
|
| C188-9 |
Phosphoflow |
Influence on proteins activity |
30.00 µM |
Kasumi-1 |
Homo sapiens |
|
p-STAT3 (Tyr-705) |
|
| C188-9 |
Phosphoflow |
Influence on proteins activity |
100.00 µM |
Kasumi-1 |
Homo sapiens |
|
p-STAT3 (Tyr-705) |
|
| C188-9 |
Phosphoflow |
Influence on proteins activity |
300.00 µM |
Kasumi-1 |
Homo sapiens |
|
p-STAT3 (Tyr-705) |
|
| C188-9 |
Phosphoflow |
Influence on proteins activity |
1.00 µM |
Kasumi-1 |
Homo sapiens |
|
p-STAT1 (Tyr-701) |
|
| C188-9 |
Phosphoflow |
Influence on proteins activity |
3.00 µM |
Kasumi-1 |
Homo sapiens |
|
p-STAT1 (Tyr-701) |
|
| C188-9 |
Phosphoflow |
Influence on proteins activity |
10.00 µM |
Kasumi-1 |
Homo sapiens |
|
p-STAT1 (Tyr-701) |
|
| C188-9 |
Phosphoflow |
Influence on proteins activity |
30.00 µM |
Kasumi-1 |
Homo sapiens |
|
p-STAT1 (Tyr-701) |
|
| C188-9 |
Phosphoflow |
Influence on proteins activity |
100.00 µM |
Kasumi-1 |
Homo sapiens |
|
p-STAT1 (Tyr-701) |
|
| C188-9 |
Phosphoflow |
Influence on proteins activity |
300.00 µM |
Kasumi-1 |
Homo sapiens |
|
p-STAT1 (Tyr-701) |
|
| C188-9 |
Mean fluorescence |
Influence on proteins activity |
N/A N/A |
Kasumi-1 |
Homo sapiens |
|
p-STAT3 (Tyr-705) |
|
| C188-9 |
Mean fluorescence |
Influence on proteins activity |
N/A N/A |
Kasumi-1 |
Homo sapiens |
|
p-STAT1 (Tyr-701) |
|
| C188-9 |
Luminex |
Influence on proteins activity |
0.10 µM |
Kasumi-1 |
Homo sapiens |
|
p-STAT3 (Tyr-705) |
|
| C188-9 |
Luminex |
Influence on proteins activity |
0.30 µM |
Kasumi-1 |
Homo sapiens |
|
p-STAT3 (Tyr-705) |
|
| C188-9 |
Luminex |
Influence on proteins activity |
1.00 µM |
Kasumi-1 |
Homo sapiens |
|
p-STAT3 (Tyr-705) |
|
| C188-9 |
Luminex |
Influence on proteins activity |
3.00 µM |
Kasumi-1 |
Homo sapiens |
|
p-STAT3 (Tyr-705) |
|
| C188-9 |
Luminex |
Influence on proteins activity |
10.00 µM |
Kasumi-1 |
Homo sapiens |
|
p-STAT3 (Tyr-705) |
|
| C188-9 |
Luminex |
Influence on proteins activity |
100.00 µM |
Kasumi-1 |
Homo sapiens |
|
p-STAT3 (Tyr-705) |
|
| C188-9 |
Luminex |
Influence on proteins activity |
0.10 µM |
Kasumi-1 |
Homo sapiens |
|
p-STAT1 (Tyr-701) |
|
| C188-9 |
Luminex |
Influence on proteins activity |
0.30 µM |
Kasumi-1 |
Homo sapiens |
|
p-STAT1 (Tyr-701) |
|
| C188-9 |
Luminex |
Influence on proteins activity |
1.00 µM |
Kasumi-1 |
Homo sapiens |
|
p-STAT1 (Tyr-701) |
|
| C188-9 |
Luminex |
Influence on proteins activity |
3.00 µM |
Kasumi-1 |
Homo sapiens |
|
p-STAT1 (Tyr-701) |
|
| C188-9 |
Luminex |
Influence on proteins activity |
10.00 µM |
Kasumi-1 |
Homo sapiens |
|
p-STAT1 (Tyr-701) |
|
| C188-9 |
Luminex |
Influence on proteins activity |
100.00 µM |
Kasumi-1 |
Homo sapiens |
|
p-STAT1 (Tyr-701) |
|
| C188-9 |
Luminex |
Influence on proteins activity |
0.10 µM |
UM-SCC-17B |
Homo sapiens |
|
p-STAT3 (Tyr-705) |
|
| C188-9 |
Luminex |
Influence on proteins activity |
0.30 µM |
UM-SCC-17B |
Homo sapiens |
|
p-STAT3 (Tyr-705) |
|
| C188-9 |
Luminex |
Influence on proteins activity |
1.00 µM |
UM-SCC-17B |
Homo sapiens |
|
p-STAT3 (Tyr-705) |
|
| C188-9 |
Luminex |
Influence on proteins activity |
3.00 µM |
UM-SCC-17B |
Homo sapiens |
|
p-STAT3 (Tyr-705) |
|
| C188-9 |
Luminex |
Influence on proteins activity |
10.00 µM |
UM-SCC-17B |
Homo sapiens |
|
p-STAT3 (Tyr-705) |
|
| C188-9 |
Luminex |
Influence on proteins activity |
100.00 µM |
UM-SCC-17B |
Homo sapiens |
|
p-STAT3 (Tyr-705) |
|
| C188-9 |
Luminex |
Influence on proteins activity |
0.10 µM |
UM-SCC-17B |
Homo sapiens |
|
p-STAT1 (Tyr-701) |
|
| C188-9 |
Luminex |
Influence on proteins activity |
0.30 µM |
UM-SCC-17B |
Homo sapiens |
|
p-STAT1 (Tyr-701) |
|
| C188-9 |
Luminex |
Influence on proteins activity |
1.00 µM |
UM-SCC-17B |
Homo sapiens |
|
p-STAT1 (Tyr-701) |
|
| C188-9 |
Luminex |
Influence on proteins activity |
3.00 µM |
UM-SCC-17B |
Homo sapiens |
|
p-STAT1 (Tyr-701) |
|
| C188-9 |
Luminex |
Influence on proteins activity |
10.00 µM |
UM-SCC-17B |
Homo sapiens |
|
p-STAT1 (Tyr-701) |
|
| C188-9 |
Luminex |
Influence on proteins activity |
100.00 µM |
UM-SCC-17B |
Homo sapiens |
|
p-STAT1 (Tyr-701) |
|
| C188-9 |
MTT |
Influence on cell viability and proliferation |
0.10 µM |
UM-SCC-17B |
Homo sapiens |
|
|
|
| C188-9 |
MTT |
Influence on cell viability and proliferation |
0.30 µM |
UM-SCC-17B |
Homo sapiens |
|
|
|
| C188-9 |
MTT |
Influence on cell viability and proliferation |
1.00 µM |
UM-SCC-17B |
Homo sapiens |
|
|
|
| C188-9 |
MTT |
Influence on cell viability and proliferation |
3.00 µM |
UM-SCC-17B |
Homo sapiens |
|
|
|
| C188-9 |
MTT |
Influence on cell viability and proliferation |
10.00 µM |
UM-SCC-17B |
Homo sapiens |
|
|
|
| C188-9 |
MTT |
Influence on cell viability and proliferation |
100.00 µM |
UM-SCC-17B |
Homo sapiens |
|
|
|
| C188-9 |
MTT |
Influence on cell viability and proliferation |
0.10 µM |
SCC-35 |
Homo sapiens |
|
|
|
| C188-9 |
MTT |
Influence on cell viability and proliferation |
0.30 µM |
SCC-35 |
Homo sapiens |
|
|
|
| C188-9 |
MTT |
Influence on cell viability and proliferation |
1.00 µM |
SCC-35 |
Homo sapiens |
|
|
|
| C188-9 |
MTT |
Influence on cell viability and proliferation |
3.00 µM |
SCC-35 |
Homo sapiens |
|
|
|
| C188-9 |
MTT |
Influence on cell viability and proliferation |
10.00 µM |
SCC-35 |
Homo sapiens |
|
|
|
| C188-9 |
MTT |
Influence on cell viability and proliferation |
100.00 µM |
SCC-35 |
Homo sapiens |
|
|
|
| C188-9 |
MTT |
Influence on cell viability and proliferation |
0.10 µM |
SCC-61 |
Homo sapiens |
|
|
|
| C188-9 |
MTT |
Influence on cell viability and proliferation |
0.30 µM |
SCC-61 |
Homo sapiens |
|
|
|
| C188-9 |
MTT |
Influence on cell viability and proliferation |
1.00 µM |
SCC-61 |
Homo sapiens |
|
|
|
| C188-9 |
MTT |
Influence on cell viability and proliferation |
3.00 µM |
SCC-61 |
Homo sapiens |
|
|
|
| C188-9 |
MTT |
Influence on cell viability and proliferation |
10.00 µM |
SCC-61 |
Homo sapiens |
|
|
|
| C188-9 |
MTT |
Influence on cell viability and proliferation |
100.00 µM |
SCC-61 |
Homo sapiens |
|
|
|
| C188-9 |
MTT |
Influence on cell viability and proliferation |
0.10 µM |
HN30 |
Homo sapiens |
|
|
|
| C188-9 |
MTT |
Influence on cell viability and proliferation |
0.30 µM |
HN30 |
Homo sapiens |
|
|
|
| C188-9 |
MTT |
Influence on cell viability and proliferation |
1.00 µM |
HN30 |
Homo sapiens |
|
|
|
| C188-9 |
MTT |
Influence on cell viability and proliferation |
3.00 µM |
HN30 |
Homo sapiens |
|
|
|
| C188-9 |
MTT |
Influence on cell viability and proliferation |
10.00 µM |
HN30 |
Homo sapiens |
|
|
|
| C188-9 |
MTT |
Influence on cell viability and proliferation |
100.00 µM |
HN30 |
Homo sapiens |
|
|
|
| C188-9 |
Tumor volume |
Influence on tumor growth |
50.00 mg/kg |
UM-SCC-17B(xengraft) |
Mus musculus |
nude |
|
|
| C188-9 |
Western Blot |
Influence on tumor growth |
50.00 mg/kg |
UM-SCC-17B(xengraft) |
Mus musculus |
nude |
p-STAT3 (Tyr-705) |
|
| C188-9 |
Western Blot |
Influence on tumor growth |
50.00 mg/kg |
UM-SCC-17B(xengraft) |
Mus musculus |
nude |
STAT3 |
|
| C188-9 |
Western Blot |
Influence on tumor growth |
50.00 mg/kg |
UM-SCC-17B(xengraft) |
Mus musculus |
nude |
|
|
| C188-9 |
Western Blot |
Influence on tumor growth |
50.00 mg/kg |
UM-SCC-17B(xengraft) |
Mus musculus |
nude |
p-STAT1 (Tyr-701) |
|
| C188-9 |
Western Blot |
Influence on tumor growth |
50.00 mg/kg |
UM-SCC-17B(xengraft) |
Mus musculus |
nude |
STAT1 |
|
| C188-9 |
Western Blot |
Level of STAT3 estimation |
N/A N/A |
Hep-2 |
Homo sapiens |
|
p-STAT3 (Tyr-705) |
|
| C188-9 |
Western Blot |
Level of STAT3 estimation |
N/A N/A |
Hep-2 |
Homo sapiens |
|
STAT3 |
|
| C188-9 |
Western Blot |
Level of STAT3 estimation |
N/A N/A |
Hep-2 |
Homo sapiens |
|
|
|
| C188-9 |
Western Blot |
Level of STAT3 estimation |
N/A N/A |
CAL27 |
Homo sapiens |
|
p-STAT3 (Tyr-705) |
|
| C188-9 |
Western Blot |
Level of STAT3 estimation |
N/A N/A |
CAL27 |
Homo sapiens |
|
STAT3 |
|
| C188-9 |
Western Blot |
Level of STAT3 estimation |
N/A N/A |
CAL27 |
Homo sapiens |
|
|
|
| C188-9 |
Western Blot |
Level of STAT3 estimation |
N/A N/A |
SCC9 |
Homo sapiens |
|
p-STAT3 (Tyr-705) |
|
| C188-9 |
Western Blot |
Level of STAT3 estimation |
N/A N/A |
SCC9 |
Homo sapiens |
|
STAT3 |
|
| C188-9 |
Western Blot |
Level of STAT3 estimation |
N/A N/A |
SCC9 |
Homo sapiens |
|
|
|
| C188-9 |
Western Blot |
Level of STAT3 estimation |
N/A N/A |
SCC15 |
Homo sapiens |
|
p-STAT3 (Tyr-705) |
|
| C188-9 |
Western Blot |
Level of STAT3 estimation |
N/A N/A |
SCC15 |
Homo sapiens |
|
STAT3 |
|
| C188-9 |
Western Blot |
Level of STAT3 estimation |
N/A N/A |
SCC15 |
Homo sapiens |
|
|
|
| C188-9 |
Western Blot |
Level of STAT3 estimation |
N/A N/A |
SCC25 |
Homo sapiens |
|
p-STAT3 (Tyr-705) |
|
| C188-9 |
Western Blot |
Level of STAT3 estimation |
N/A N/A |
SCC25 |
Homo sapiens |
|
STAT3 |
|
| C188-9 |
Western Blot |
Level of STAT3 estimation |
N/A N/A |
SCC25 |
Homo sapiens |
|
|
|
| C188-9 |
Western Blot |
Influence on proteins level |
N/A N/A |
SCC15 |
Homo sapiens |
|
p-STAT1 (Tyr-701) |
|
| C188-9 |
Western Blot |
Influence on proteins level |
N/A N/A |
SCC15 |
Homo sapiens |
|
STAT1 |
|
| C188-9 |
Western Blot |
Influence on proteins level |
N/A N/A |
SCC15 |
Homo sapiens |
|
p-STAT3 (Tyr-705) |
|
| C188-9 |
Western Blot |
Influence on proteins level |
N/A N/A |
SCC15 |
Homo sapiens |
|
STAT3 |
|
| C188-9 |
Western Blot |
Influence on proteins level |
N/A N/A |
SCC15 |
Homo sapiens |
|
|
|
| C188-9 |
Western Blot |
Influence on proteins level |
N/A N/A |
SCC25 |
Homo sapiens |
|
p-STAT1 (Tyr-701) |
|
| C188-9 |
Western Blot |
Influence on proteins level |
N/A N/A |
SCC25 |
Homo sapiens |
|
STAT1 |
|
| C188-9 |
Western Blot |
Influence on proteins level |
N/A N/A |
SCC25 |
Homo sapiens |
|
p-STAT3 (Tyr-705) |
|
| C188-9 |
Western Blot |
Influence on proteins level |
N/A N/A |
SCC25 |
Homo sapiens |
|
STAT3 |
|
| C188-9 |
Western Blot |
Influence on proteins level |
N/A N/A |
SCC25 |
Homo sapiens |
|
|
|
| C188-9 |
Western Blot |
Influence on nuclear translocation |
N/A N/A |
SCC15 |
Homo sapiens |
|
p-STAT3 (Tyr-705) |
|
| C188-9 |
Western Blot |
Influence on nuclear translocation |
N/A N/A |
SCC15 |
Homo sapiens |
|
|
|
| C188-9 |
Western Blot |
Influence on nuclear translocation |
N/A N/A |
SCC25 |
Homo sapiens |
|
p-STAT3 (Tyr-705) |
|
| C188-9 |
Western Blot |
Influence on nuclear translocation |
N/A N/A |
SCC25 |
Homo sapiens |
|
|
|
| C188-9 |
Luciferase activity |
Influence on transcriptional activity |
N/A N/A |
SCC15 |
Homo sapiens |
|
STAT3 |
|
| C188-9 |
Luciferase activity |
Influence on transcriptional activity |
N/A N/A |
SCC25 |
Homo sapiens |
|
STAT3 |
|
| C188-9 |
Colony formation assay |
Influence on cell proliferation |
N/A N/A |
SCC15 |
Homo sapiens |
|
|
|
| C188-9 |
Colony formation assay |
Influence on cell proliferation |
N/A N/A |
SCC25 |
Homo sapiens |
|
|
|
| C188-9 |
MTT |
Influence on cell proliferation |
N/A N/A |
SCC15 |
Homo sapiens |
|
|
|
| C188-9 |
MTT |
Influence on cell proliferation |
N/A N/A |
SCC25 |
Homo sapiens |
|
|
|
| C188-9 |
Cell cycle analysis |
Influence on cell proliferation |
N/A N/A |
SCC15 |
Homo sapiens |
|
|
|
| C188-9 |
Cell cycle analysis |
Influence on cell proliferation |
N/A N/A |
SCC25 |
Homo sapiens |
|
|
|
| C188-9 |
Flow cytometry |
Influence on cell apoptosis |
N/A N/A |
SCC15 |
Homo sapiens |
|
|
|
| C188-9 |
Flow cytometry |
Influence on cell apoptosis |
N/A N/A |
SCC25 |
Homo sapiens |
|
|
|
| C188-9 |
Western Blot |
Influence on cell apoptosis |
N/A N/A |
SCC15 |
Homo sapiens |
|
|
|
| C188-9 |
Western Blot |
Influence on cell apoptosis |
N/A N/A |
SCC15 |
Homo sapiens |
|
|
|
| C188-9 |
Western Blot |
Influence on cell apoptosis |
N/A N/A |
SCC15 |
Homo sapiens |
|
|
|
| C188-9 |
Western Blot |
Influence on cell apoptosis |
N/A N/A |
SCC25 |
Homo sapiens |
|
|
|
| C188-9 |
Western Blot |
Influence on cell apoptosis |
N/A N/A |
SCC25 |
Homo sapiens |
|
|
|
| C188-9 |
Western Blot |
Influence on cell apoptosis |
N/A N/A |
SCC25 |
Homo sapiens |
|
|
|
| C188-9 |
Wound healing assay |
Influence on cell mobility |
N/A N/A |
SCC15 |
Homo sapiens |
|
|
|
| C188-9 |
Wound healing assay |
Influence on cell mobility |
N/A N/A |
SCC25 |
Homo sapiens |
|
|
|
| C188-9 |
MTT |
Influence on cisplatin cell sensitivity |
N/A N/A |
SCC15 |
Homo sapiens |
|
|
|
| C188-9 |
MTT |
Influence on cisplatin cell sensitivity |
N/A N/A |
SCC25 |
Homo sapiens |
|
|
|
| C188-9 |
Western Blot |
Influence on cisplatin cell sensitivity |
N/A N/A |
SCC15 |
Homo sapiens |
|
|
|
| C188-9 |
Western Blot |
Influence on cisplatin cell sensitivity |
N/A N/A |
SCC15 |
Homo sapiens |
|
|
|
| C188-9 |
Western Blot |
Influence on cisplatin cell sensitivity |
N/A N/A |
SCC15 |
Homo sapiens |
|
|
|
| C188-9 |
Western Blot |
Influence on cisplatin cell sensitivity |
N/A N/A |
SCC25 |
Homo sapiens |
|
|
|
| C188-9 |
Western Blot |
Influence on cisplatin cell sensitivity |
N/A N/A |
SCC25 |
Homo sapiens |
|
|
|
| C188-9 |
Western Blot |
Influence on cisplatin cell sensitivity |
N/A N/A |
SCC25 |
Homo sapiens |
|
|
|
| C188-9 |
Western Blot |
Influence on protein |
0.90 µM |
A375 |
Homo sapiens |
|
|
|
| C188-9 |
Western Blot |
Influence on protein |
0.90 µM |
C8161 |
Homo sapiens |
|
|
|
| C188-9 |
Western Blot |
Influence on protein |
0.90 µM |
A375 |
Homo sapiens |
|
|
|
| C188-9 |
Western Blot |
Influence on protein |
0.90 µM |
C8161 |
Homo sapiens |
|
|
|
| C188-9 |
Western Blot |
Influence on protein |
0.90 µM |
A375 |
Homo sapiens |
|
|
|
| C188-9 |
Western Blot |
Influence on protein |
0.90 µM |
C8161 |
Homo sapiens |
|
|
|
| C188-9 |
Western Blot |
Influence on protein |
0.90 µM |
A375 |
Homo sapiens |
|
|
|
| C188-9 |
Western Blot |
Influence on protein |
0.90 µM |
C8161 |
Homo sapiens |
|
|
|
| C188-9 |
Western Blot |
Influence on protein |
0.90 µM |
A375 |
Homo sapiens |
|
|
|
| C188-9 |
Western Blot |
Influence on protein |
0.90 µM |
C8161 |
Homo sapiens |
|
|
|
| C188-9 |
Western Blot |
Influence on protein |
0.90 µM |
A375 |
Homo sapiens |
|
|
|
| C188-9 |
Western Blot |
Influence on protein |
0.90 µM |
C8161 |
Homo sapiens |
|
|
|
| C188-9 |
Immunofluorescence |
Influence on protein in presence of IL6 |
0.90 µM |
A375 |
Homo sapiens |
|
|
|
| C188-9 |
Immunofluorescence |
Influence on protein in presence of IL6 |
0.90 µM |
C8161 |
Homo sapiens |
|
|
|
| C188-9 |
Flow cytometry |
Influence on protein in presence of IL6 |
0.90 µM |
A375 |
Homo sapiens |
|
|
|
| C188-9 |
Flow cytometry |
Influence on protein in presence of IL6 |
0.90 µM |
C8161 |
Homo sapiens |
|
|
|
| C188-9 |
Western Blot |
Influence on protein in presence of IL6 |
0.90 µM |
A375 |
Homo sapiens |
|
|
|
| C188-9 |
Western Blot |
Influence on protein in presence of IL6 |
0.90 µM |
C8161 |
Homo sapiens |
|
|
|
| C188-9 |
Western Blot |
Influence on protein in presence of IL6 |
0.90 µM |
A375 |
Homo sapiens |
|
|
|
| C188-9 |
Western Blot |
Influence on protein in presence of IL6 |
0.90 µM |
C8161 |
Homo sapiens |
|
|
|
| C188-9 |
Western Blot |
Influence on protein in presence of IL6 |
0.90 µM |
A375 |
Homo sapiens |
|
|
|
| C188-9 |
Western Blot |
Influence on protein in presence of IL6 |
0.90 µM |
C8161 |
Homo sapiens |
|
|
|
| C188-9 |
Western Blot |
Influence on protein in presence of IL6 |
0.90 µM |
A375 |
Homo sapiens |
|
|
|
| C188-9 |
Western Blot |
Influence on protein in presence of IL6 |
0.90 µM |
C8161 |
Homo sapiens |
|
|
|
| C188-9 |
Western Blot |
Influence on protein in presence of IL6 |
0.90 µM |
A375 |
Homo sapiens |
|
|
|
| C188-9 |
Western Blot |
Influence on protein in presence of IL6 |
0.90 µM |
C8161 |
Homo sapiens |
|
|
|
| C188-9 |
Western Blot |
Influence on protein in presence of IL6 |
0.90 µM |
A375 |
Homo sapiens |
|
|
|
| C188-9 |
Western Blot |
Influence on protein in presence of IL6 |
0.90 µM |
C8161 |
Homo sapiens |
|
|
|
| C188-9 |
Western Blot |
Influence on protein in presence of IL6 |
0.90 µM |
A375 |
Homo sapiens |
|
|
|
| C188-9 |
Western Blot |
Influence on protein in presence of IL6 |
0.90 µM |
C8161 |
Homo sapiens |
|
|
|
| C188-9 |
ELISA |
Influence on protein in presence of IL6 |
0.90 µM |
A375 |
Homo sapiens |
|
|
|
| C188-9 |
ELISA |
Influence on protein in presence of IL6 |
0.90 µM |
C8161 |
Homo sapiens |
|
|
|
| C188-9 |
Virus yield examination |
Influence on protein in presence of IL6 and vrus |
0.90 µM |
A375 |
Homo sapiens |
|
|
|
| C188-9 |
Virus yield examination |
Influence on protein in presence of IL6 and vrus |
0.90 µM |
C8161 |
Homo sapiens |
|
|
|
| C188-9 |
Luminex |
Influence on STAT3 levels in lung tissue in presence of house dust mites |
10.00 mg/kg |
lung tissue |
Mus musculus |
c57BL/6 |
p-STAT3 |
|
| C188-9 |
Luminex |
Influence on STAT3 levels in lung tissue in presence of house dust mites |
10.00 mg/kg |
lung tissue |
Mus musculus |
c57BL/6 |
STAT3 |
|
| C188-9 |
Alcian Blue-PAS staining |
Influence on lung epithelium thickness in presence of house dust mite |
10.00 mg/kg |
lung tissue |
Mus musculus |
c57BL/6 |
|
|
| C188-9 |
Luminex |
Influence on cytokine levels in lung tissue in presence of house dust mites |
10.00 mg/kg |
lung tissue |
Mus musculus |
c57BL/6 |
|
|
| C188-9 |
Luminex |
Influence on cytokine levels in lung tissue in presence of house dust mites |
10.00 mg/kg |
lung tissue |
Mus musculus |
c57BL/6 |
|
|
| C188-9 |
Luminex |
Influence on cytokine levels in lung tissue in presence of house dust mites |
10.00 mg/kg |
lung tissue |
Mus musculus |
c57BL/6 |
|
|
| C188-9 |
Luminex |
Influence on cytokine levels in lung tissue in presence of house dust mites |
10.00 mg/kg |
lung tissue |
Mus musculus |
c57BL/6 |
|
|
| C188-9 |
Luminex |
Influence on cytokine levels in serum in presence of house dust mites |
10.00 mg/kg |
serum |
Mus musculus |
c57BL/6 |
|
|
| C188-9 |
Flow cytometry |
Effect of inhibitor on cytokine frequencies expressing CD4+ T cells |
10.00 mg/kg |
bronchoalveolar lavage fluid |
Mus musculus |
c57BL/6 |
|
|
| C188-9 |
Flow cytometry |
Effect of inhibitor on cytokine frequencies expressing CD4+ T cells |
10.00 mg/kg |
bronchoalveolar lavage fluid |
Mus musculus |
c57BL/6 |
|
|
| C188-9 |
Flow cytometry |
Effect of inhibitor on cytokine frequencies expressing CD4+ T cells |
10.00 mg/kg |
bronchoalveolar lavage fluid |
Mus musculus |
c57BL/6 |
|
|
| C188-9 |
Flow cytometry |
Effect of inhibitor on cytokine frequencies expressing CD4+ T cells |
10.00 mg/kg |
bronchoalveolar lavage fluid |
Mus musculus |
c57BL/6 |
|
|
| C188-9 |
Flow cytometry |
Effect of inhibitor on cytokine frequencies expressing CD4+ T cells |
10.00 mg/kg |
lung tissue |
Mus musculus |
c57BL/6 |
|
|
| C188-9 |
Flow cytometry |
Effect of inhibitor on cytokine frequencies expressing CD4+ T cells |
10.00 mg/kg |
lung tissue |
Mus musculus |
c57BL/6 |
|
|
| C188-9 |
Flow cytometry |
Effect of inhibitor on cytokine frequencies expressing CD4+ T cells |
10.00 mg/kg |
lung tissue |
Mus musculus |
c57BL/6 |
|
|
| C188-9 |
Flow cytometry |
Effect of inhibitor on cytokine frequencies expressing CD4+ T cells |
10.00 mg/kg |
lung tissue |
Mus musculus |
c57BL/6 |
|
|
| C188-9 |
Flow cytometry |
Effect of inhibitor on cytokine frequencies expressing CD3- T cells |
10.00 mg/kg |
lung tissue |
Mus musculus |
c57BL/6 |
|
|
| C188-9 |
Flow cytometry |
Effect of inhibitor on cytokine frequencies expressing CD3- T cells |
10.00 mg/kg |
lung tissue |
Mus musculus |
c57BL/6 |
|
|
| C188-9 |
Flow cytometry |
Effect of inhibitor on cytokine frequencies expressing CD3- T cells |
10.00 mg/kg |
lung tissue |
Mus musculus |
c57BL/6 |
|
|
| C188-9 |
Flow cytometry |
Effect of inhibitor on cytokine frequencies expressing CD3- T cells |
10.00 mg/kg |
lung tissue |
Mus musculus |
c57BL/6 |
|
|
| C188-9 |
Luminex |
STAT3 activation level in NSCLC cell lines |
N/A N/A |
HBEC |
Homo sapiens |
|
|
|
| C188-9 |
Luminex |
STAT3 activation level in NSCLC cell lines |
N/A N/A |
H1563 |
Homo sapiens |
|
|
|
| C188-9 |
Luminex |
STAT3 activation level in NSCLC cell lines |
N/A N/A |
H1437 |
Homo sapiens |
|
|
|
| C188-9 |
Luminex |
STAT3 activation level in NSCLC cell lines |
N/A N/A |
H661 |
Homo sapiens |
|
|
|
| C188-9 |
Luminex |
STAT3 activation level in NSCLC cell lines |
N/A N/A |
H2126 |
Homo sapiens |
|
|
|
| C188-9 |
Luminex |
STAT3 activation level in NSCLC cell lines |
N/A N/A |
A549 |
Homo sapiens |
|
|
|
| C188-9 |
Luminex |
STAT3 activation level in NSCLC cell lines |
N/A N/A |
H1573 |
Homo sapiens |
|
|
|
| C188-9 |
Luminex |
STAT3 activation level in NSCLC cell lines |
N/A N/A |
H1299 |
Homo sapiens |
|
|
|
| C188-9 |
Luminex |
STAT3 activation level in NSCLC cell lines |
N/A N/A |
H1975 |
Homo sapiens |
|
|
|
| C188-9 |
Western Blot |
STAT3 activation level in various cell lines |
N/A N/A |
MEF-STAT3α |
Homo sapiens |
|
STAT3α |
|
| C188-9 |
Western Blot |
STAT3 activation level in various cell lines |
N/A N/A |
MEF-STAT3β |
Homo sapiens |
|
STAT3α |
|
| C188-9 |
Western Blot |
STAT3 activation level in various cell lines |
N/A N/A |
HBEC3-KT |
Homo sapiens |
|
STAT3α |
|
| C188-9 |
Western Blot |
STAT3 activation level in various cell lines |
N/A N/A |
HBEC |
Homo sapiens |
|
STAT3α |
|
| C188-9 |
Western Blot |
STAT3 activation level in various cell lines |
N/A N/A |
H1563 |
Homo sapiens |
|
STAT3α |
|
| C188-9 |
Western Blot |
STAT3 activation level in various cell lines |
N/A N/A |
H1437 |
Homo sapiens |
|
STAT3α |
|
| C188-9 |
Western Blot |
STAT3 activation level in various cell lines |
N/A N/A |
H661 |
Homo sapiens |
|
STAT3α |
|
| C188-9 |
Western Blot |
STAT3 activation level in various cell lines |
N/A N/A |
H2126 |
Homo sapiens |
|
STAT3α |
|
| C188-9 |
Western Blot |
STAT3 activation level in various cell lines |
N/A N/A |
A549 |
Homo sapiens |
|
STAT3α |
|
| C188-9 |
Western Blot |
STAT3 activation level in various cell lines |
N/A N/A |
H1573 |
Homo sapiens |
|
STAT3α |
|
| C188-9 |
Western Blot |
STAT3 activation level in various cell lines |
N/A N/A |
H1299 |
Homo sapiens |
|
STAT3α |
|
| C188-9 |
Western Blot |
STAT3 activation level in various cell lines |
N/A N/A |
H1975 |
Homo sapiens |
|
STAT3α |
|
| C188-9 |
Western Blot |
STAT3 activation level in various cell lines |
N/A N/A |
MEF-STAT3α |
Homo sapiens |
|
STAT3β |
|
| C188-9 |
Western Blot |
STAT3 activation level in various cell lines |
N/A N/A |
MEF-STAT3β |
Homo sapiens |
|
STAT3β |
|
| C188-9 |
Western Blot |
STAT3 activation level in various cell lines |
N/A N/A |
HBEC3-KT |
Homo sapiens |
|
STAT3β |
|
| C188-9 |
Western Blot |
STAT3 activation level in various cell lines |
N/A N/A |
HBEC |
Homo sapiens |
|
STAT3β |
|
| C188-9 |
Western Blot |
STAT3 activation level in various cell lines |
N/A N/A |
H1563 |
Homo sapiens |
|
STAT3β |
|
| C188-9 |
Western Blot |
STAT3 activation level in various cell lines |
N/A N/A |
H1437 |
Homo sapiens |
|
STAT3β |
|
| C188-9 |
Western Blot |
STAT3 activation level in various cell lines |
N/A N/A |
H661 |
Homo sapiens |
|
STAT3β |
|
| C188-9 |
Western Blot |
STAT3 activation level in various cell lines |
N/A N/A |
H2126 |
Homo sapiens |
|
STAT3β |
|
| C188-9 |
Western Blot |
STAT3 activation level in various cell lines |
N/A N/A |
A549 |
Homo sapiens |
|
STAT3β |
|
| C188-9 |
Western Blot |
STAT3 activation level in various cell lines |
N/A N/A |
H1573 |
Homo sapiens |
|
STAT3β |
|
| C188-9 |
Western Blot |
STAT3 activation level in various cell lines |
N/A N/A |
H1299 |
Homo sapiens |
|
STAT3β |
|
| C188-9 |
Western Blot |
STAT3 activation level in various cell lines |
N/A N/A |
H1975 |
Homo sapiens |
|
STAT3β |
|
| C188-9 |
Western Blot |
STAT3 activation level in various cell lines |
N/A N/A |
MEF-STAT3α |
Homo sapiens |
|
|
|
| C188-9 |
Western Blot |
STAT3 activation level in various cell lines |
N/A N/A |
MEF-STAT3β |
Homo sapiens |
|
|
|
| C188-9 |
Western Blot |
STAT3 activation level in various cell lines |
N/A N/A |
HBEC3-KT |
Homo sapiens |
|
|
|
| C188-9 |
Western Blot |
STAT3 activation level in various cell lines |
N/A N/A |
HBEC |
Homo sapiens |
|
|
|
| C188-9 |
Western Blot |
STAT3 activation level in various cell lines |
N/A N/A |
H1563 |
Homo sapiens |
|
|
|
| C188-9 |
Western Blot |
STAT3 activation level in various cell lines |
N/A N/A |
H1437 |
Homo sapiens |
|
|
|
| C188-9 |
Western Blot |
STAT3 activation level in various cell lines |
N/A N/A |
H661 |
Homo sapiens |
|
|
|
| C188-9 |
Western Blot |
STAT3 activation level in various cell lines |
N/A N/A |
H2126 |
Homo sapiens |
|
|
|
| C188-9 |
Western Blot |
STAT3 activation level in various cell lines |
N/A N/A |
A549 |
Homo sapiens |
|
|
|
| C188-9 |
Western Blot |
STAT3 activation level in various cell lines |
N/A N/A |
H1573 |
Homo sapiens |
|
|
|
| C188-9 |
Western Blot |
STAT3 activation level in various cell lines |
N/A N/A |
H1299 |
Homo sapiens |
|
|
|
| C188-9 |
Western Blot |
STAT3 activation level in various cell lines |
N/A N/A |
H1975 |
Homo sapiens |
|
|
|
| C188-9 |
Luminex beads |
Influence o protein levels |
30.00 µM |
A549 |
Homo sapiens |
|
p-STAT3 |
|
| C188-9 |
Luminex beads |
Influence o protein levels |
0.00 µM |
A549 |
Homo sapiens |
|
p-STAT3 |
|
| C188-9 |
Luminex beads |
Influence o protein levels |
0.03 µM |
A549 |
Homo sapiens |
|
p-STAT3 |
|
| C188-9 |
Luminex beads |
Influence o protein levels |
0.01 µM |
A549 |
Homo sapiens |
|
p-STAT3 |
|
| C188-9 |
Luminex beads |
Influence o protein levels |
0.30 µM |
A549 |
Homo sapiens |
|
p-STAT3 |
|
| C188-9 |
Luminex beads |
Influence o protein levels |
0.10 µM |
A549 |
Homo sapiens |
|
p-STAT3 |
|
| C188-9 |
Luminex beads |
Influence o protein levels |
1.00 µM |
A549 |
Homo sapiens |
|
p-STAT3 |
|
| C188-9 |
Luminex beads |
Influence o protein levels |
3.00 µM |
A549 |
Homo sapiens |
|
p-STAT3 |
|
| C188-9 |
Luminex beads |
Influence o protein levels |
10.00 µM |
A549 |
Homo sapiens |
|
p-STAT3 |
|
| C188-9 |
Luminex beads |
Influence o protein levels |
100.00 µM |
A549 |
Homo sapiens |
|
p-STAT3 |
|
| C188-9 |
MTT |
Influence on cell proliferation |
0.00 µM |
A549 |
Homo sapiens |
|
|
|
| C188-9 |
MTT |
Influence on cell proliferation |
0.03 µM |
A549 |
Homo sapiens |
|
|
|
| C188-9 |
MTT |
Influence on cell proliferation |
0.01 µM |
A549 |
Homo sapiens |
|
|
|
| C188-9 |
MTT |
Influence on cell proliferation |
0.30 µM |
A549 |
Homo sapiens |
|
|
|
| C188-9 |
MTT |
Influence on cell proliferation |
0.10 µM |
A549 |
Homo sapiens |
|
|
|
| C188-9 |
MTT |
Influence on cell proliferation |
1.00 µM |
A549 |
Homo sapiens |
|
|
|
| C188-9 |
MTT |
Influence on cell proliferation |
3.00 µM |
A549 |
Homo sapiens |
|
|
|
| C188-9 |
MTT |
Influence on cell proliferation |
10.00 µM |
A549 |
Homo sapiens |
|
|
|
| C188-9 |
MTT |
Influence on cell proliferation |
30.00 µM |
A549 |
Homo sapiens |
|
|
|
| C188-9 |
MTT |
Influence on cell proliferation |
100.00 µM |
A549 |
Homo sapiens |
|
|
|
| C188-9 |
RT-PCR |
Influence on STAT3 target gene expression |
30.00 µM |
A549 |
Homo sapiens |
|
|
|
| C188-9 |
RT-PCR |
Influence on STAT3 target gene expression |
30.00 µM |
A549 |
Homo sapiens |
|
|
|
| C188-9 |
RT-PCR |
Influence on STAT3 target gene expression |
30.00 µM |
A549 |
Homo sapiens |
|
|
|
| C188-9 |
RT-PCR |
Influence on STAT3 target gene expression |
30.00 µM |
A549 |
Homo sapiens |
|
|
|
| C188-9 |
Flow cytometry |
Influence on apoptosis |
30.00 µM |
A549 |
Homo sapiens |
|
|
|
| C188-9 |
Tumor volume, weight |
Influence on tumor growth |
50.00 mg/kg |
A549(xenograft) |
Mus musculus |
|
|
|
| C188-9 |
RT-PCR |
Influence on STAT3 target gene expression in tumor |
50.00 mg/kg |
A549(xenograft) |
Mus musculus |
|
|
|
| C188-9 |
RT-PCR |
Influence on STAT3 target gene expression in tumor |
50.00 mg/kg |
A549(xenograft) |
Mus musculus |
|
|
|
| C188-9 |
RT-PCR |
Influence on STAT3 target gene expression in tumor |
50.00 mg/kg |
A549(xenograft) |
Mus musculus |
|
|
|
| C188-9 |
RT-PCR |
Influence on STAT3 target gene expression in tumor |
50.00 mg/kg |
A549(xenograft) |
Mus musculus |
|
|
|
